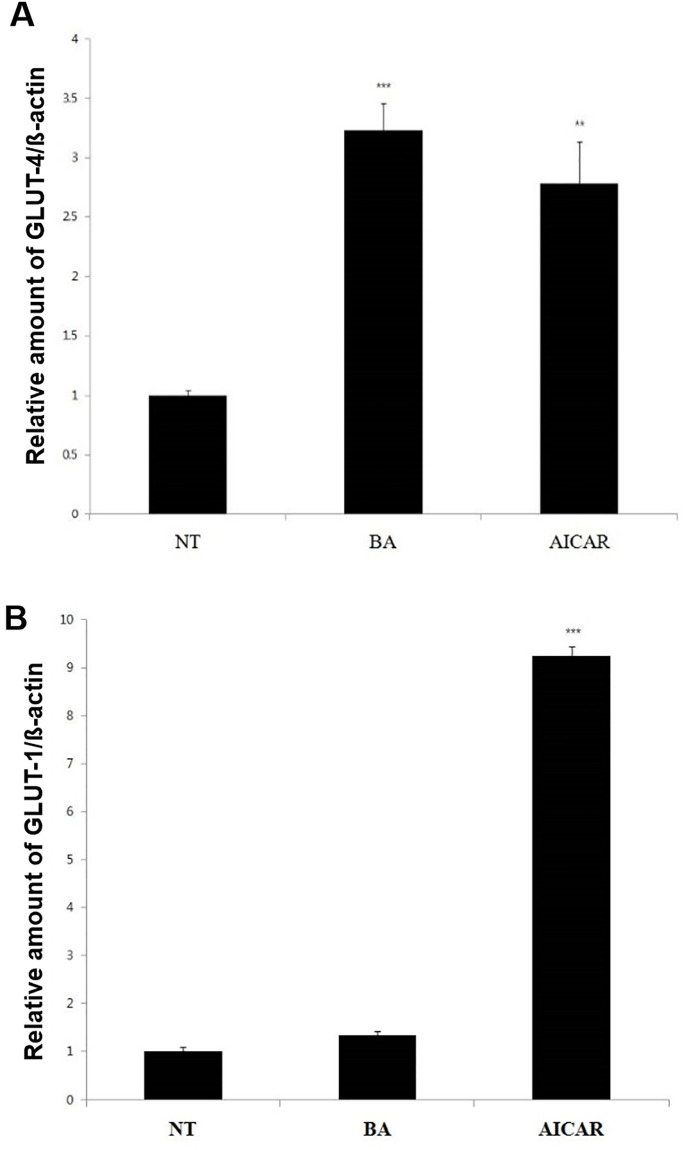
Fig 6. Effect of BA on mRNA expression of Slc2a4 and Slc2a1 genes.
The mRNA expression levels of the Slc2a4 and Slc2a1 genes that encode glucose transporters GLUT4 (Fig 6A) and GLUT1 (Fig 6B), respectively, were measured by real-time PCR in C2C12 cells. The values represent the mean fold change ± standard error of the mean (N = 3). Statistical significance of differences from the control non-treated group (NT) is indicated as follows: **P < 0.01, ***P < 0.001.

