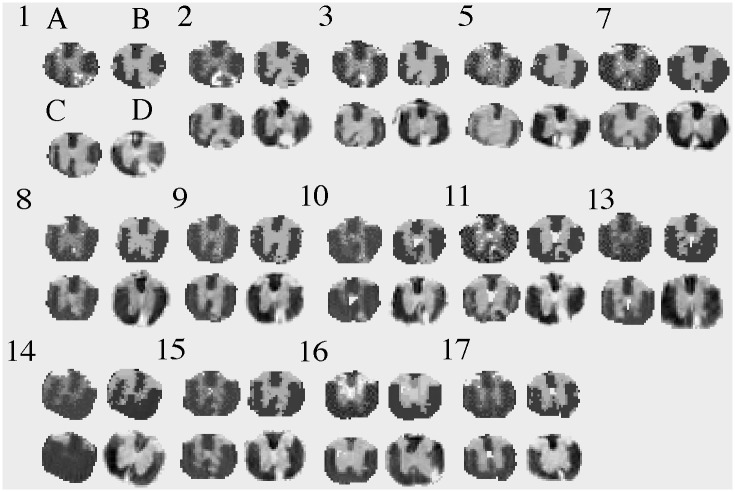
Fig 7. Cellularity predictions.
Shown are the cellularity feature images learned from the MRI of the 14 mice that have histological correspondence, using our GMRF (A), segmentation regression associated with our GMRF (B), Markov GAM using a freely available software (C), and the histological standard (D). Note: The brighter the area, the greater the cellularity, except for the large lesion cores in mice 2 and 11, which show ‘dark signal’ paradoxically with the MRI methods.

