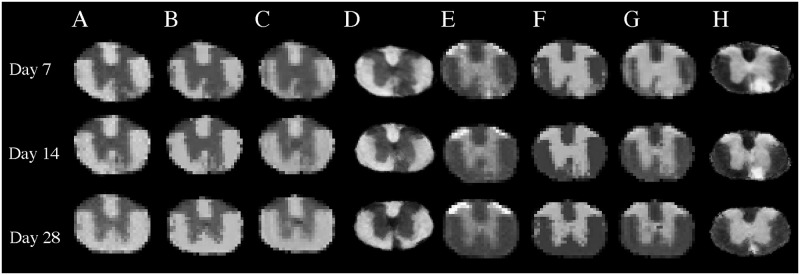
Fig 8. Myelin and cellularity predictions by cohort and time-point.
Shown are the median outcomes for myelin obtained using our GMRF (A), segmentation regression associated with our GMRF (B), Markov GAM using freely available software (C), and the median histological myelin map (D), at days 7, 14, and 28. Similarly, images E-H demonstrate the median cellularity outcomes from GMRF, segmentation regression, Markov GAM, and histology, respectively, at the corresponding time-points. Note that the MRI predicted outcome in the lesion areas at day 28 are close to normal, while the histology myelin and cellularity in the corresponding sites remain abnormal.

