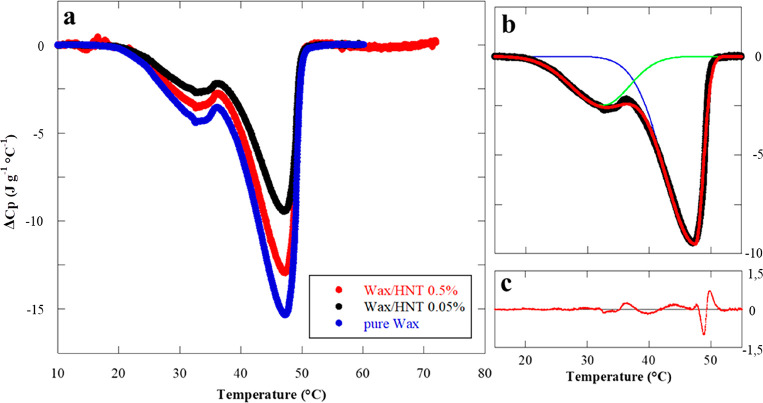
Figure 7.
μ-DSC thermograms for pure wax, wax/HNTs 0.05% w/w, and wax/HNTs 0.5% w/w Pickering emulsions (a). DSC thermogram deconvolution for the wax/HNTs 0.05% w/w sample (b). The black line in (b) represents the experimental data, the blue and green lines represent the two curves for each peak, and the red line represents the sum of these two contributions which better fits the experimental data. Residues are reported in (c). All the curves are registered while heating the samples.

