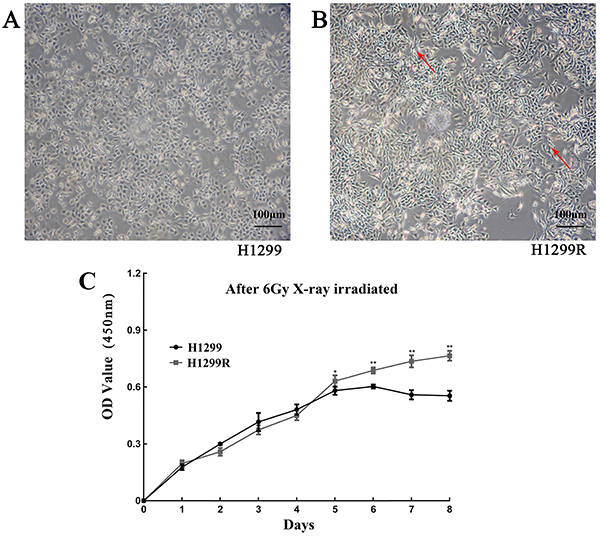
Figure 1. Morphological observation of H1299 (A) and H1299R (B) cells (magnification 20×; scale bar: 100 μm). Red arrows indicate pseudopod formation. C, Changes in the proliferative capacity of H1299 and H1299R cells. Data are reported as means±SD (n=3). *P<0.05, **P<0.01 (t-test).

