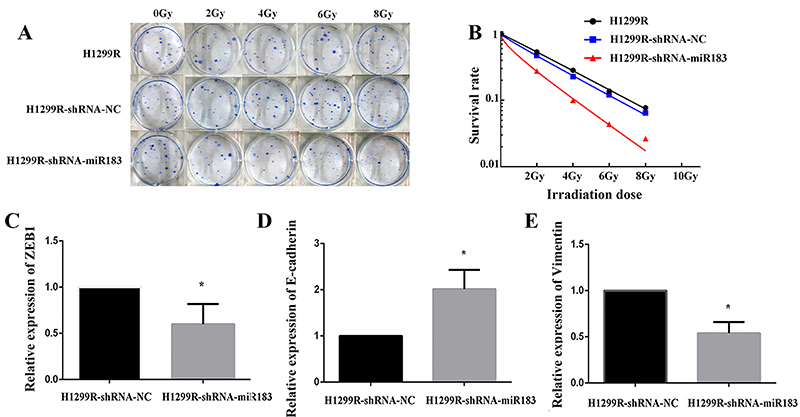
Figure 5. A, Colony formation result map (observation of >50 cell colonies under the microscope to indicate effective cell colonies). B, The cell survival curve under different doses was fitted by a multitarget model. C-E, mRNA expression of ZEB1, E-cadherin, and vimentin in the H1299R negative control (NC) group and the H1299R miR-183-downregulated expression group. Data are reported as means±SD. *P<0.05 (t-test).

