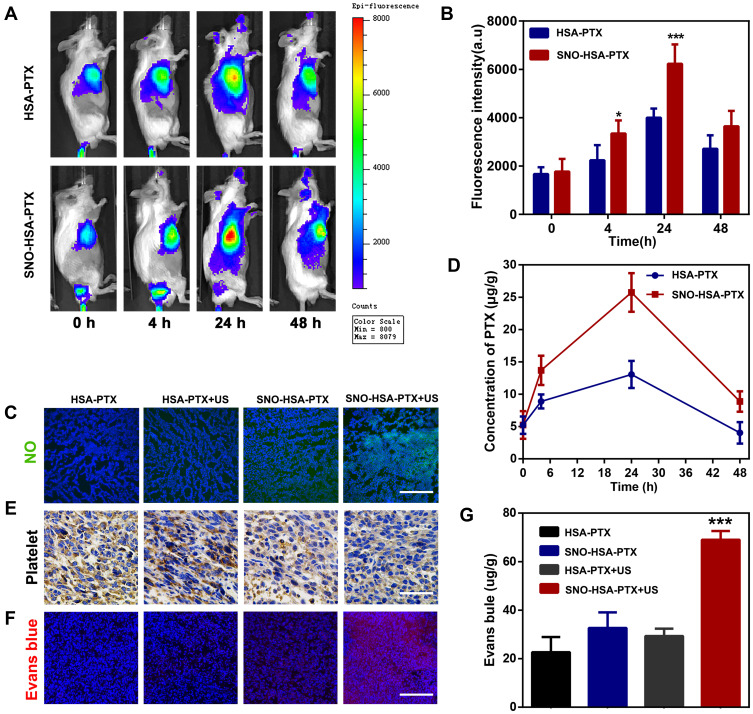
Figure 5.
Effect of SNO-HSA-PTX treatment on tumor targeting and tumor vascular permeability in vivo. (A) The in vivo distribution of IR780-labeled HSA-PTX and IR780-labeled HSA-PTX at different time points after US irradiation (1.0 MHz, 2 W/cm2, 5 min) in 4T1 tumor-bearing mice. (B) Quantitative analysis of IR780 fluorescence intensity. ***p < 0.001. (C) Immunofluorescence images of tumors slices stained with anti-nitrotyrosine from mice with different treatments. Scale bar: 200 μm. ***p < 0.001. (D) The content of PTX in tumor tissues after treatments. (E) Immunohistochemistry images of tumor sections stained with anti-CD62P antibodies. Scale bar: 50 μm. (F) Representative fluorescence images of Evans blue (red) in tumor frozen sections (DAPI; blue). Scale bar: 100 μm. (G) Quantitative determination of Evans blue in tumors by spectrophotometry at 620 nm. ***p < 0.001.

