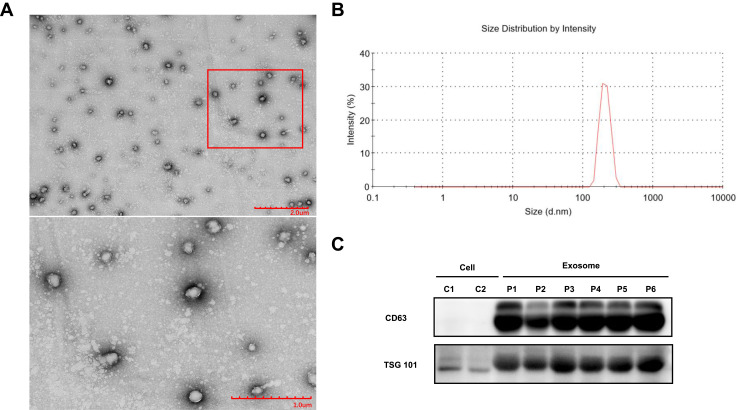
Figure 2.
Characterization of exosomes. (A) Morphological characterization of exosomes isolated from serum samples by transmission electron microscopy(TEM). Typical exosomes were amplified. Scale bar = 2 µm (upper), 1 µm (lower). (B) Nanoparticle tracking analysis (NTA) analysis revealed that the average size distribution of exosomes was 190.7 nm. (C) Western blot analysis of exosome protein markers (CD63 and TSG101).

