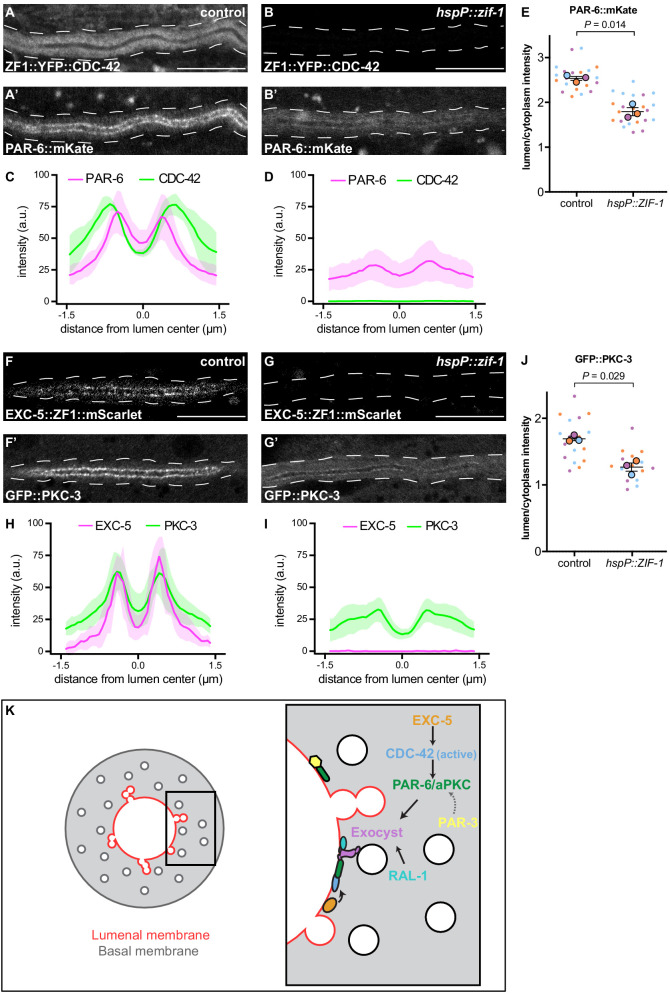
Figure 7. CDC-42 and EXC-5 are required to enrich PAR-6 and PKC-3 at the lumenal membrane.
(A–B) Distribution of ZF1::YFP::CDC-42 in larval excretory canal in control (A) and hspP::zif-1 (B) worms. (A’–B’) Distribution of PAR-6::mKate in the larval excretory canal of control (A’) and hspP::zif-1 (B’) worms expressing ZF1::YFP::CDC-42. (C–D) Line trace of ZF1::YFP::CDC-42 (green) and PAR-6::mKate (magenta). Intensities were normalized to compare peak values of each channel. ‘0.0’ on x-axis represents the center point of the canal lumen. n = 5 larvae. (E) Quantification of lumenal membrane to cytoplasm intensity ratio of PAR-6::mKate expression in the excretory canal of control and hspP::zif-1 larvae expressing ZF1::YFP::CDC-42. Individual data points (small dots) are color-coded (orange, purple, and light blue) from three independent replicates. Large dots represent the mean of each replicate, horizontal bar is the mean of means, and error bars are the SEM. p values were calculated using a ratio paired t-test of the means. n = 8, 7, 7 for control; n = 9, 7, 8 for hspP::zif-1. (F–G) Distribution of EXC-5::ZF1::mScarlet in the larval excretory canal in control (F) and hspP::zif-1 (G) worms. (F’–G’) Distribution of GFP::PKC-3 in the larval excretory canal of control (F’) and hspP::zif-1 (G’) worms expressing EXC-5::ZF1::mScarlet. (H–I) Line trace of GFP::PKC-3 (green) and EXC-5::ZF1::mScarlet (magenta). Intensities were normalized to compare peak values of each channel. ‘0.0’ on x-axis represents the center point of the canal lumen. n = 5 larvae. (J) Quantification of lumenal membrane to cytoplasm intensity ratio of GFP::PKC-3 expression in the excretory canal of control and hspP::zif-1 larvae expressing EXC-5::ZF1::mScarlet. Data are depicted as in panel E. p values were calculated using a ratio paired t-test of the means. n = 5, 6, 6 for control; n = 5, 5, 6 for hspP::zif-1. (K) Model of PAR and exocyst regulation of excretory cell lumen extension. Cross section of larval excretory canal (left) depicts large, canalicular vesicles fusing with the lumenal membrane (red) during lumen extension. Boxed region represents a portion of canal where lumen extension is occurring, magnified at right to show a proposed molecular pathway for lumenal vesicle tethering. Outline of excretory canal cytoplasm is indicated by dotted line. Scale bars, 10 μm.

