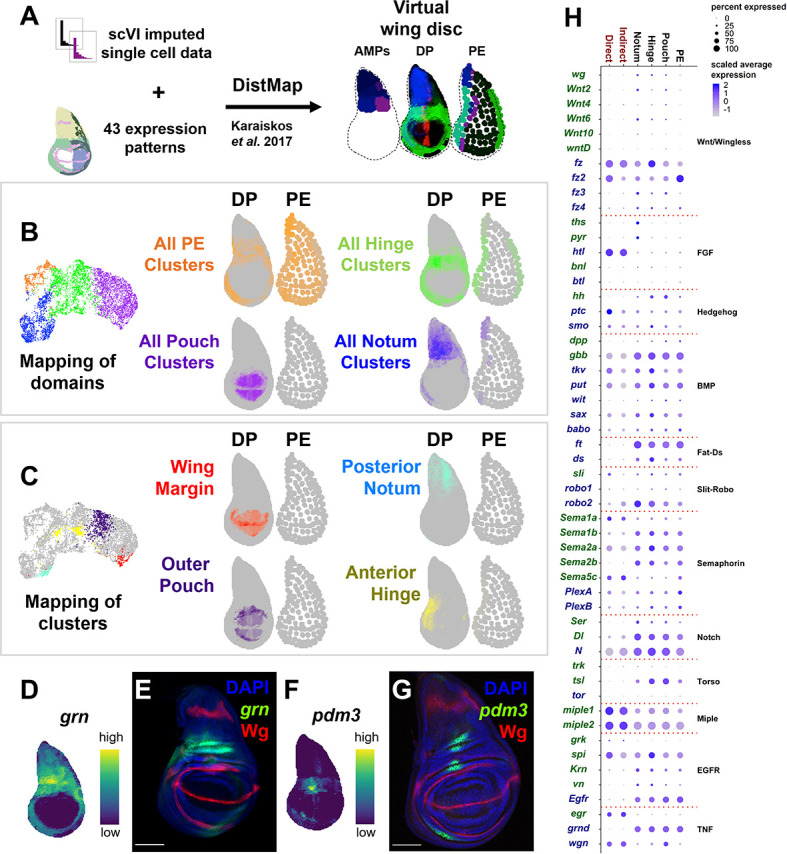
Figure 2. Spatial mapping of single-cell data to a virtual wing disc and analysis of receptor–ligand expression.
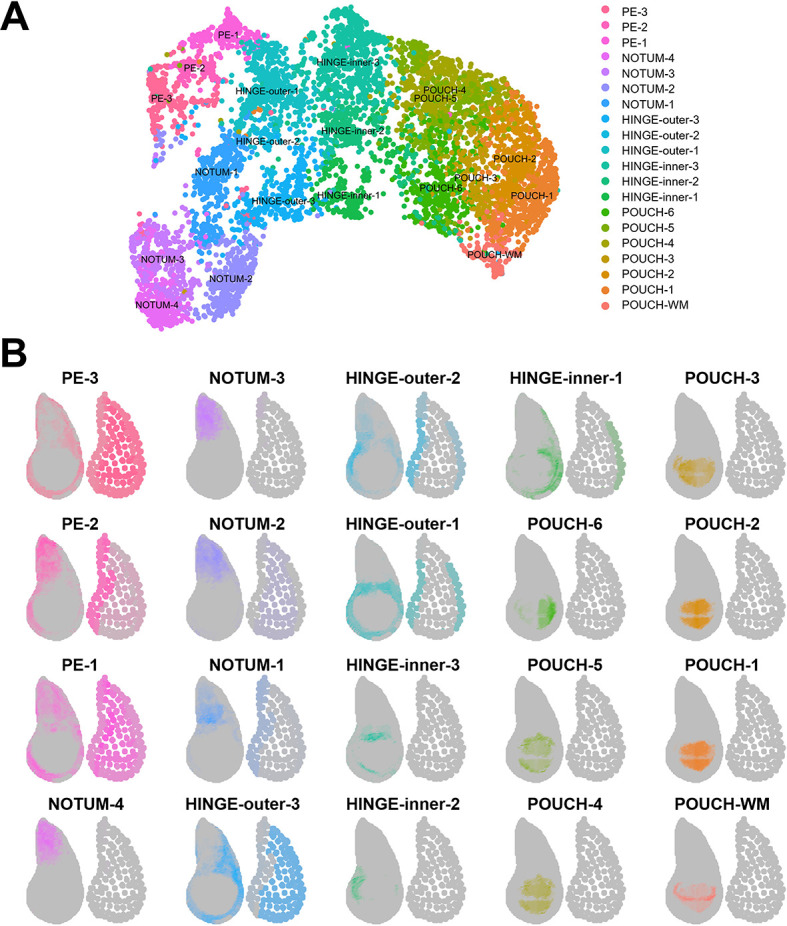
(A) Schematic describing the creation of a three-layered virtual wing disc (adult muscle precursors [AMPs], disc proper [DP], and the peripodial epithelium [PE]) using DistMap (Karaiskos et al., 2017) (see Materials and methods). In contrast to the columnar cells of the DP, much of the PE is composed of squamous cells with flattened nuclei, and it is therefore represented as an outline that contains large dots. The virtual wing disc can be used to predict gene expression patterns (or virtual in situs), as shown for three example genes (ptc in red, zfh2 in green, and eyg in blue). (B, C) Cells from the epithelial domains (B) and particular sub-regions (C) are shown both on the UMAP and mapped onto the DP and PE virtual wing disc. Stronger colors indicate higher predicted mapping; gray indicates low predicted mapping for cells (see Figure 2—figure supplement 1A, B for mappings of all cell clusters). (D, F) Predicted gene expression patterns of grn (D) and pdm3 (F) in the epithelium disc proper, neither of which were used in building the virtual model. Yellow and dark purple correspond to high and low predicted expression, respectively. (E, G) Late third instar wing-imaginal disc with transcriptional reporters for the genes grn (E) and pdm3 (G). Note the relative similarity between the predicted expression and transcriptional reporters. (H) Dot plot summarizing the expression of genes encoding receptors and ligands from pathways that were differentially expressed in at least one cell type. Dot size indicates the percent of cells that express the gene, and the dot color indicates the relative gene expression level within each of the cell groups. X-axis: cell groups. Disc epithelium cell types are in black font, and AMP cell types are in red font. Y-axis: genes are either in blue or green font depending on their annotation as encoding for a receptor or ligand, respectively. Microscopy scale bars = 100 μm.

Figure 2—figure supplement 1. Mapping of epithelium cell clusters to the virtual wing disc.

