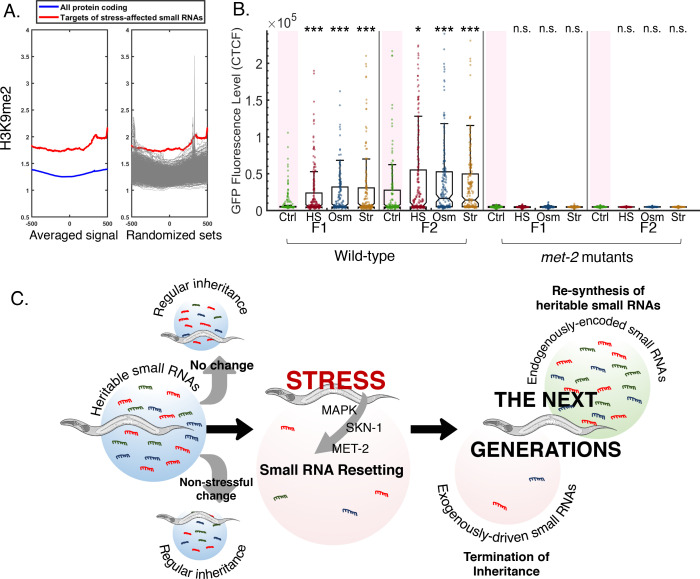
Figure 6. Stress-induced small RNA resetting depends on the H3K9 methyltransferase MET-2.
(A) Targets of stress-affected small RNAs show significantly increased H3K9me2 marks. An analysis of H3K9me2 signal (based on published data from McMurchy et al., 2017). Presented is the averaged H3K9me2 signal (y-axis) of all protein coding genes (blue) and target genes of stress-affected small RNAs (red). All genes are aligned according to their Transcription Start Sites (TSS), and the regions of 500 base pairs upstream and downstream of the TSS are shown on the x-axis. Each gray line (right panel) represents the average of a random set of genes (500 iterations) equal in size to the set of target genes of stress-affected small RNAs. (B) met-2 mutant worms do not reset heritable small RNAs in response to stress. The graph displays the measured germline GFP fluorescence levels of wild-type and met-2 mutant worms (y-axis) across generations under the indicated condition (x-axis). Each dot represents the value of an individual worm. Shown are the median of each group, with box limits representing the 25th (Q1) and 75th (Q3) percentiles, notch representing a 95% confidence interval, and whiskers indicating Q1-1.5*IQR and Q3+1.5*IQR. FDR-corrected values were obtained using Dunn’s test. Not significant (ns) indicates q ≥ 0.05, (*) indicates q < 0.05, and (***) indicates q < 0.001 (see Materials and methods). (C) A model summarizing stress-induced resetting of heritable small RNAs. Small RNAs from both endogenous and exogenous sources are reset in response to stress. Resetting is mediated by the MAPK pathway, the SKN-1 transcription factor and the H3K9 methyltransferase MET-2. Endogenous small RNAs which are encoded in the genome are re-synthesized in the next generations, while small RNAs from exogenous sources and transient responses are eliminated.


