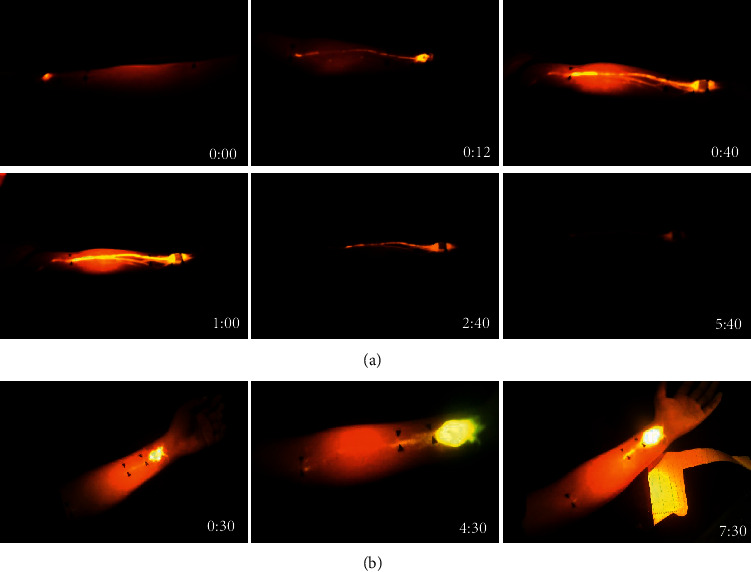
Figure 1.

Development of fluorescent lines. Migration of fluorescein from PC6 with respect to time after injection (hour: minute) as shown in right lower corners. In series (a), migration was rapid, while in series (b), migration was slower. In (a), a clear line was observed as early as 10 minutes, peaked at 60 minutes, then diminished thereafter. Of note, in (b), fluorescence at PC3 preceded appearance of the linear path between PC3 and PC4.
