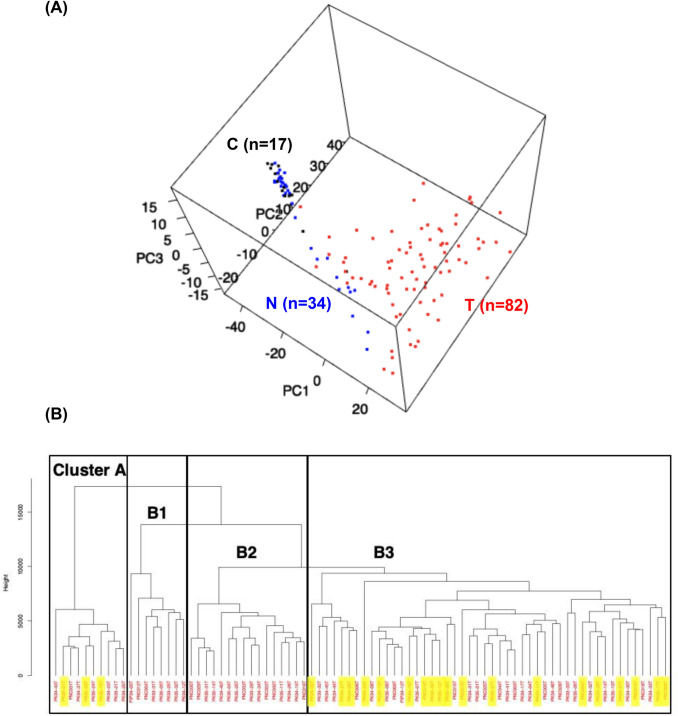
Fig. 1.
DNA methylation profiles based on Infinium assay in the initial cohort. a Principal component analysis of all 133 samples (17 C, 34 N and 82 T samples) using the 91,907 probes that were aberrantly methylated in the T samples (P value < 0.05 by Welch’s t test with Bonferroni correction and ΔβT-C value > 0.1 or < − 0.1) compared to the C samples. PC, principal component. b Hierarchical clustering (Ward’s linkage using Euclidean distances) in 82 T samples using the 66,789 probes that were aberrantly methylated in T samples (P value < 0.05 by Welch’s t test with Bonferroni correction and ΔβT-N value > 0.1 or < − 0.1) compared to the N samples. T samples were clustered into four subclasses: Clusters A (n = 10), B1 (n = 8), B2 (n = 16), and B3 (n = 48). Patients showing early recurrence defined as relapse within 6 months after surgery are marked with yellow

