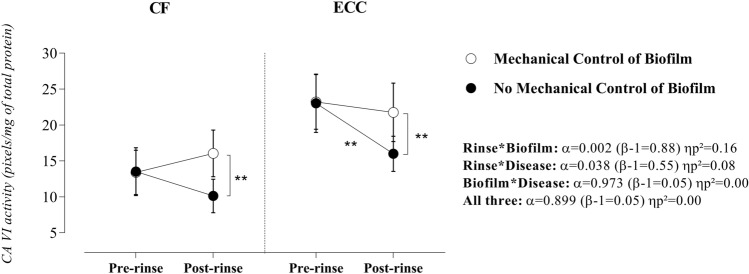
Figure 4.
Effect of rinse, mechanical control of biofilm, and disease on salivary CA VI activity. Statistical analyses were performed with a sample of 56 volunteers, 28 per group. ηp2: Partial eta squared. Data plotted as mean and standard deviations (due to Gaussian distribution). Considering the presence of significant interactions, the main effects of rinse, disease, and biofilm were suppressed. A single asterisk represents a significant p-value ≤ 0.05. A double asterisk represents a p-value ≤ 0.01. Simple effects for Rinse in CF children—Mechanical control of biofilm: α = 0.15 (β-1 = 0.30) ηp2 = 0.04 and No mechanical control of biofilm: α = 0.07 (β-1 = 0.43) ηp2 = 0.06). Simple effects for Rinse in children with ECC—Mechanical control of biofilm: α = 0.42 (β-1 = 0.13) ηp2 = 0.01 and No mechanical control of biofilm: α = 0.000 (β-1 = 0.96) ηp2 = 0.21. Simple effects for Biofilm in CF children—Pre-rinse: α = 0.96 (β-1 = 0.05) ηp2 = 0.000 and Post-rinse: α = 0.003 (β-1 = 0.86) ηp2 = 0.15. Simple effects for Biofilm in children with ECC—Pre-rinse: α = 0.93 (β-1 = 0.05) ηp2 = 0.000 and Post-rinse: α = 0.004 (β-1 = 0.84) ηp2 = 0.14. Simple Effects for Disease in Pre-rinse condition—Mechanical control of biofilm: α = 0.000 (β-1 = 0.98) ηp2 = 0.24 and No mechanical control of biofilm: α = 0.000 (β-1 = 0.95) ηp2 = 0.20. Simple Effects for Disease in Post-rinse condition—Mechanical control of biofilm: α = 0.03 (β-1 = 0.60) ηp2 = 0.09 and No mechanical control of biofilm: α = 0.000 (β-1 = 0.94) ηp2 = 0.19. Supplementary material provides complementary information regarding data statistics.

