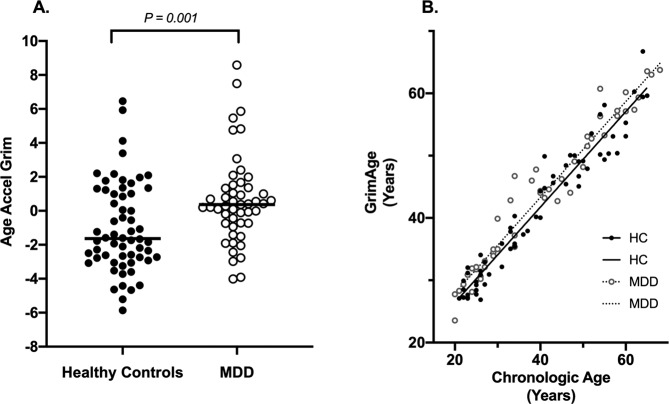
Fig. 1. Cross-section differences in AgeAccelGrim between healthy controls and patients with major depressive disorder (MDD).
A Plotted values are raw AgeAccelGrim measures (in years), prior to Blom transformation. p-value reflects two-tailed significance between groups, based on Blom-transformed data to achieve normality of distribution. Horizontal line indicates median AgeAccelGrim within each group. NHealthy Control = 60, NMDD = 49. B Plotted values are participants’ chronological age plotted against GrimAge (prior to age-adjustment), demonstrating a strong correlation between chronological age and GrimAge among both participants with MDD and healthy controls (HC) (Combined: Spearman Rho = 0.968, p < 0.001; MDD: Spearman Rho = 0.974, p < 0.001; HC: Spearman Rho = 0.961, p < 0.001).

