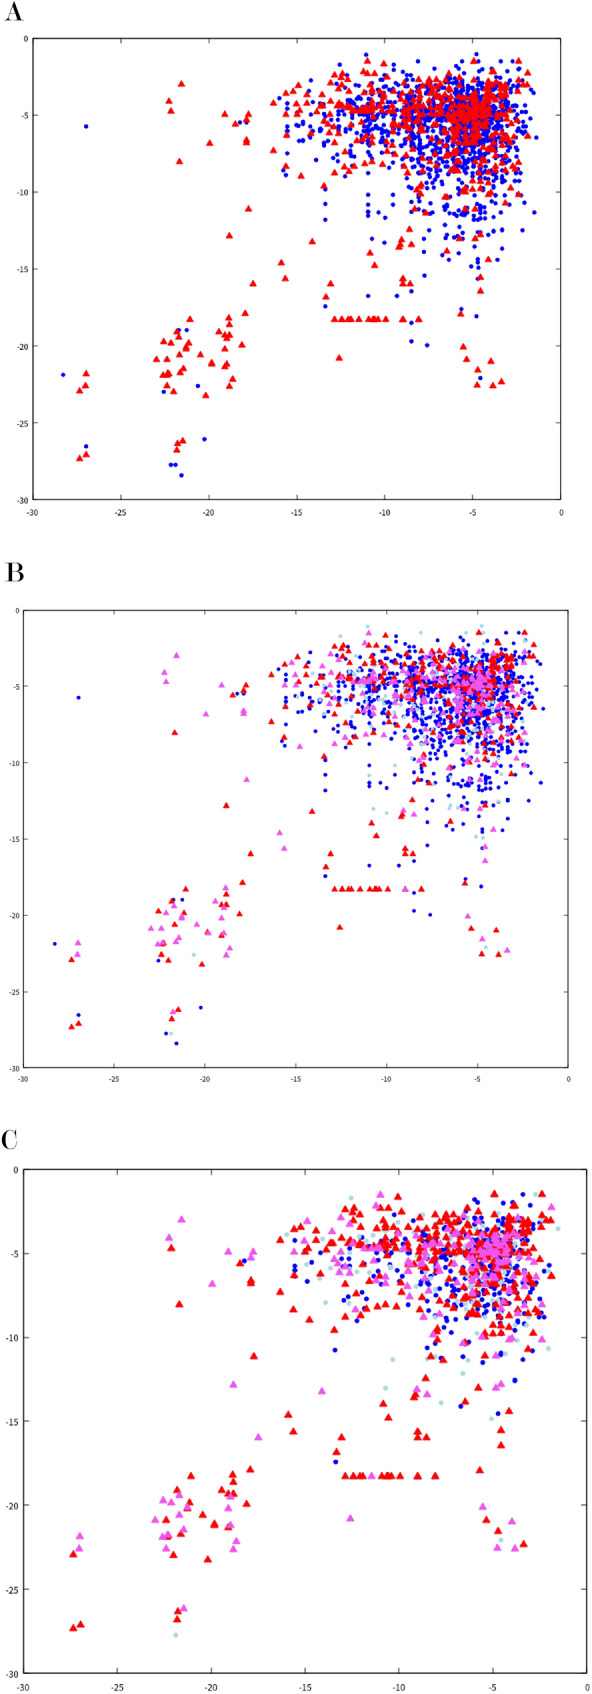
Figure 5.

Scatter plot of PCR-results and predictions. Plot the PCR results and RNN-predictions against the Gibbs energy at the hydrogen bond at the forward (horizontal axis) and reverse (vertical axis) priming positions determined at the time of pseudo-sentence determination (Fig. 2). Colors and shape show the following results and predictions; red triangle: PCR-positive-prediction-positive, pink triangle: PCR-positive-prediction-negative, blue circle: PCR-negative-prediction-negative, light blue circle: PCR-negative-prediction-positive. Primer pair-template sets excluded from predictions during undersampling were not plotted.
