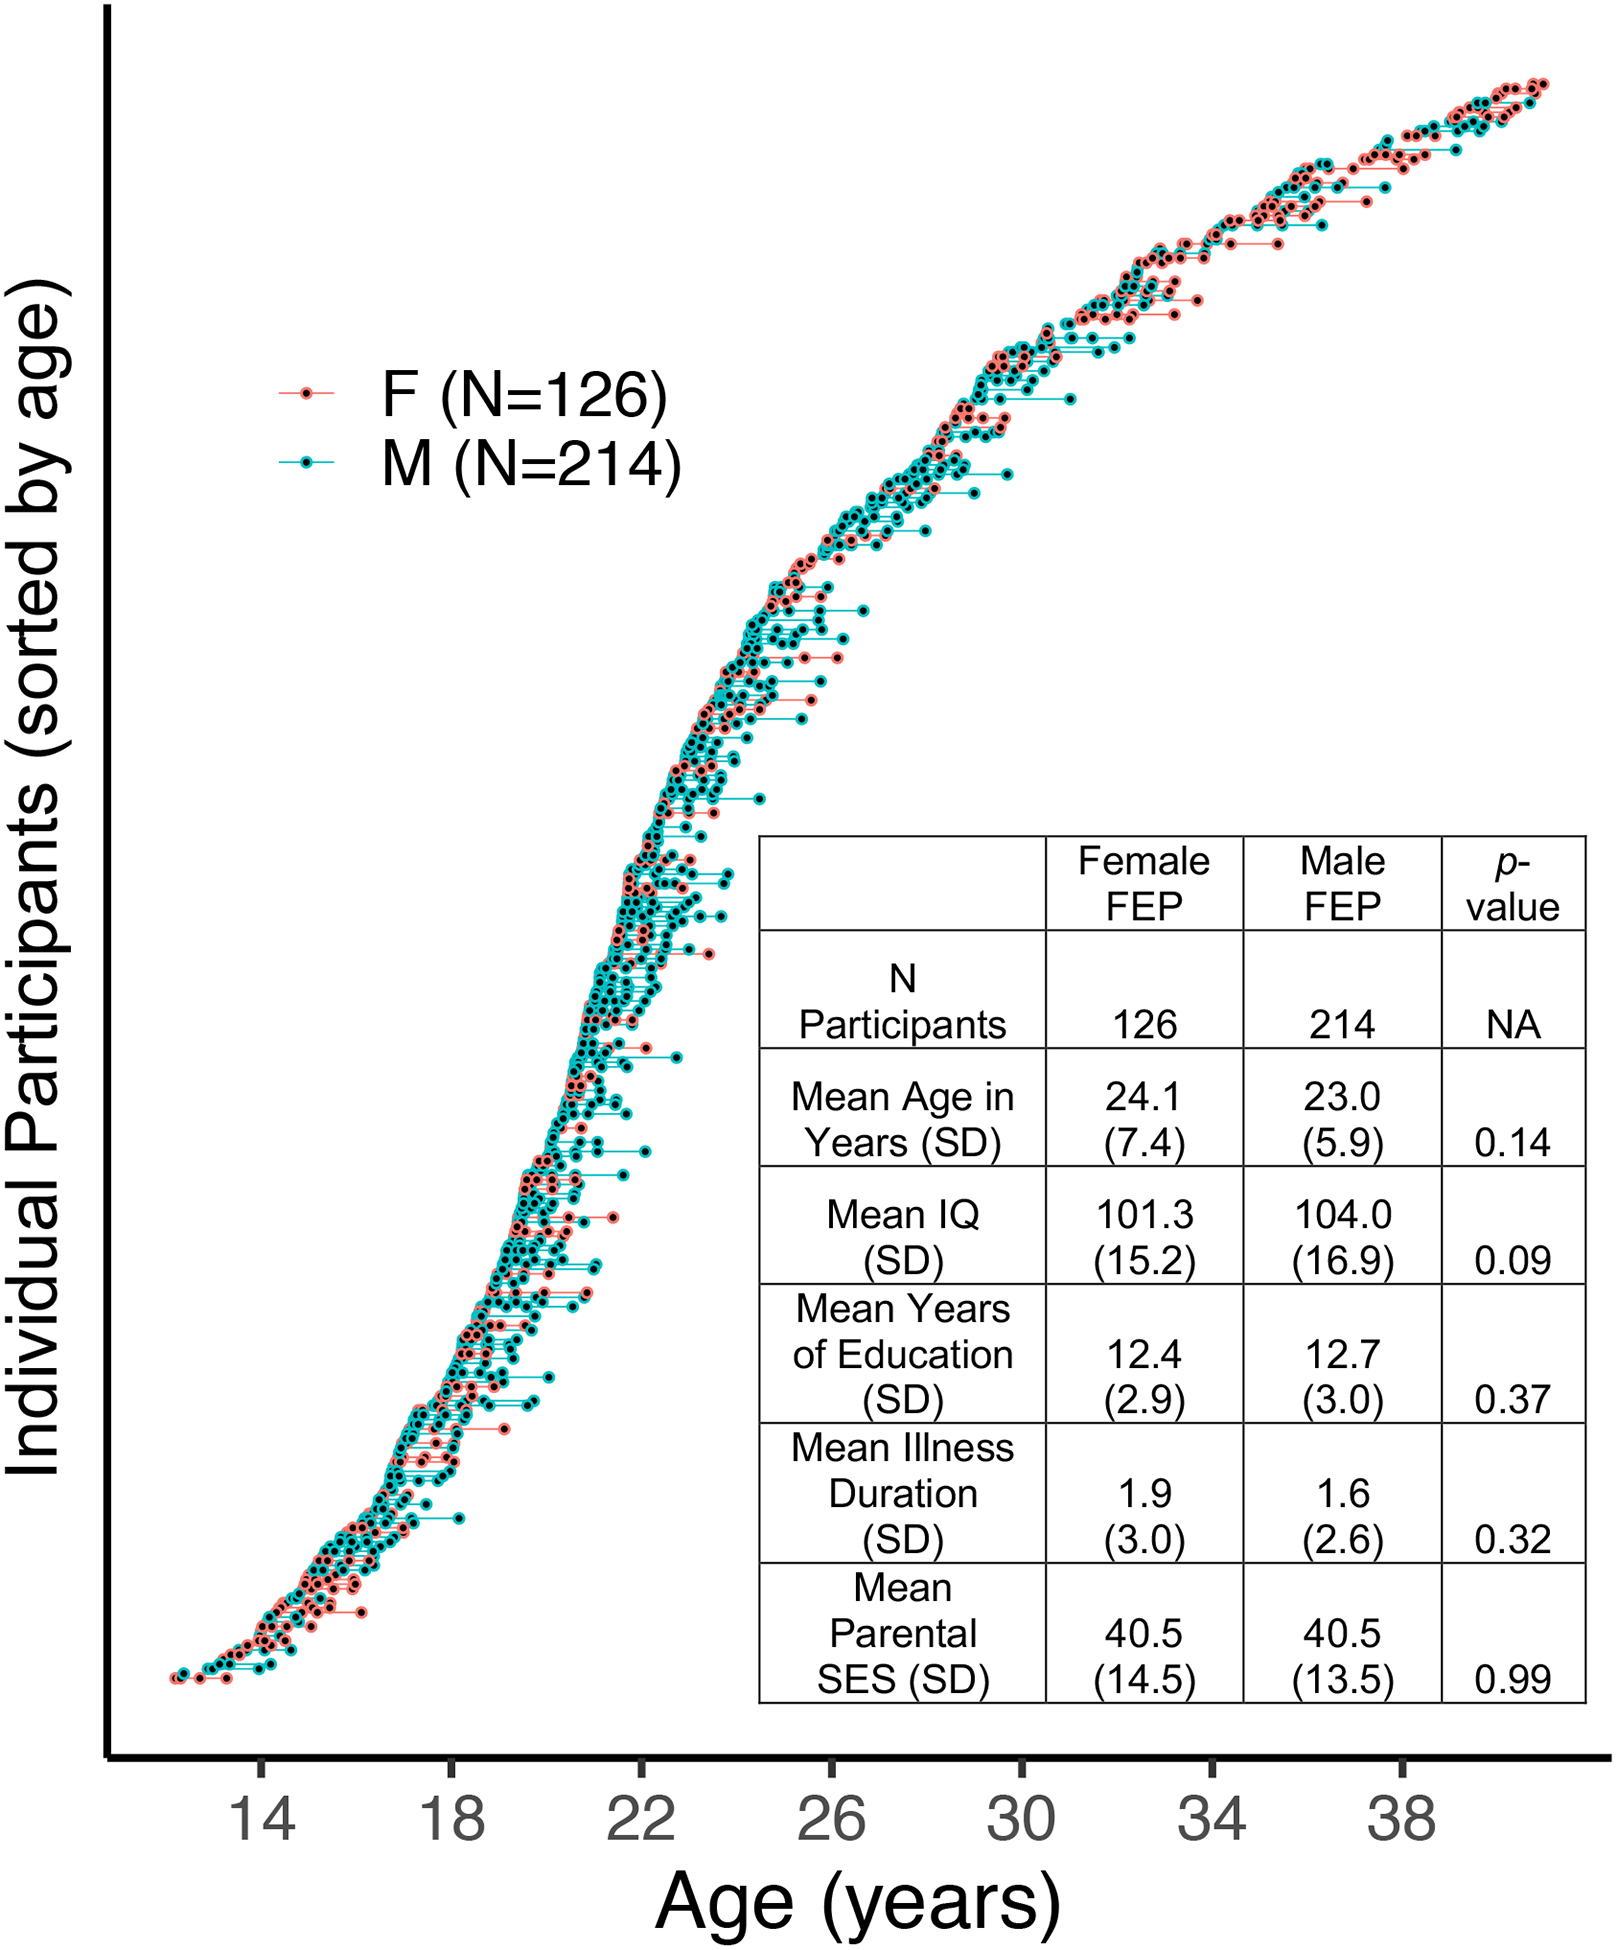
Figure 1.

Waterfall plot of all participants and their respective visits (blue circles=male, red circles=female). Each individual circle represents a participant at a particular visit. Lines connecting the circles refer to the time in between visits. A demographic table is in the bottom right of the plot. Two-hundred ninety individuals (85%) had 2 or more visits.
