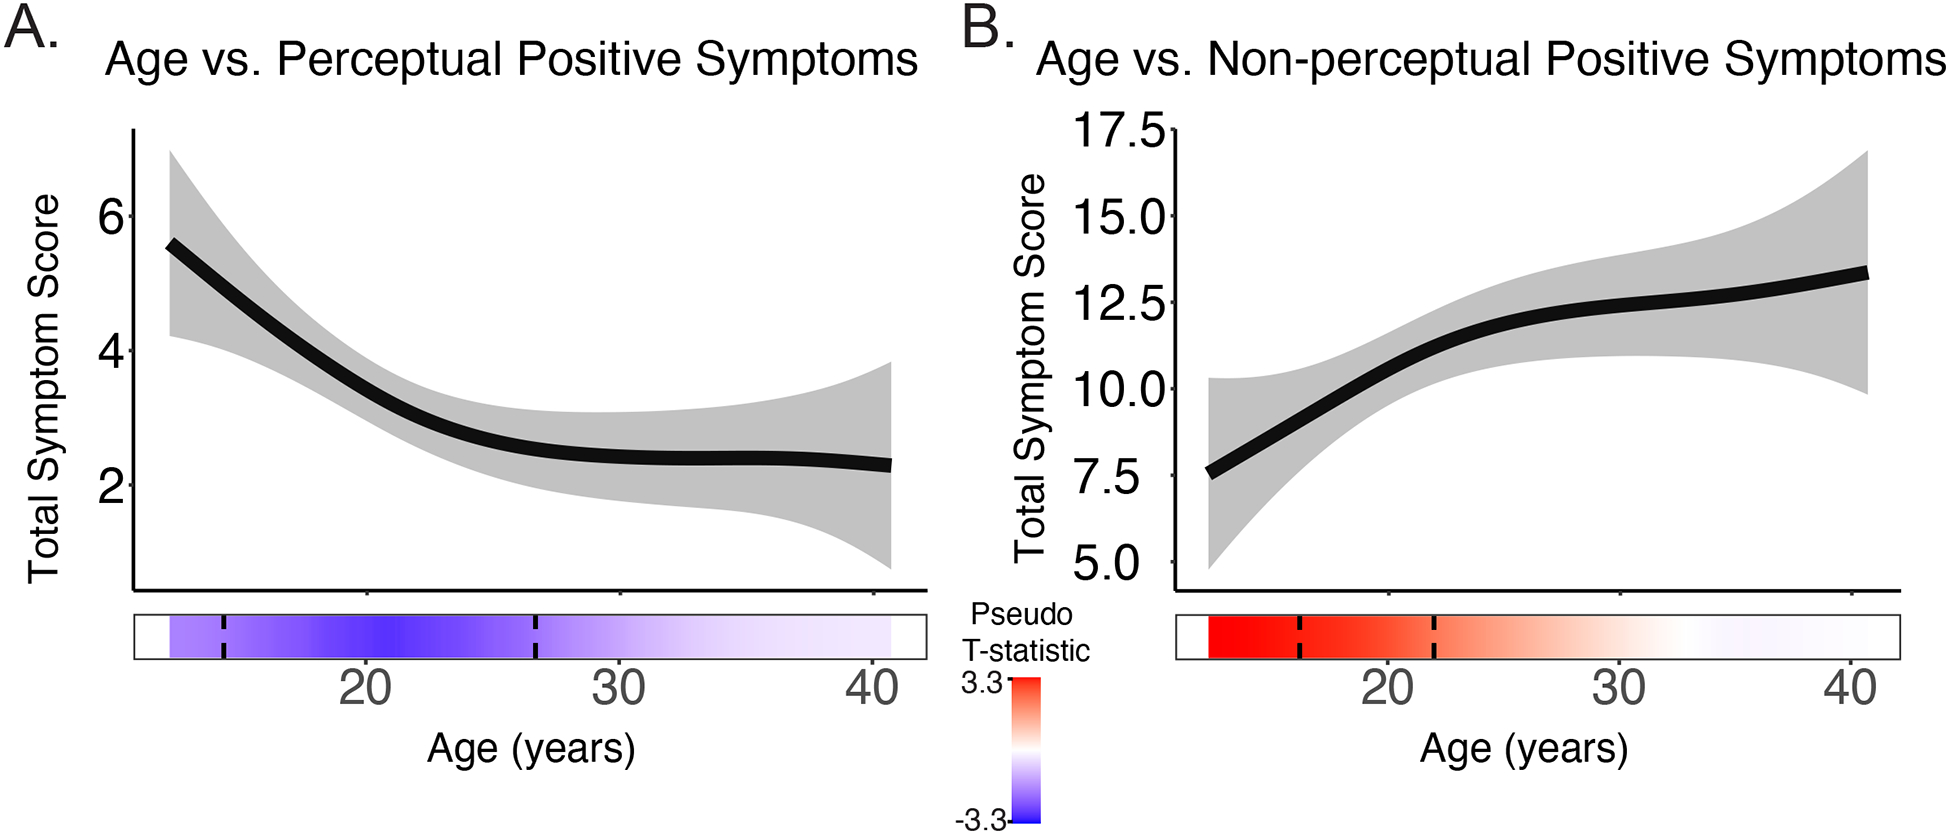
Figure 2.

A) Perceptual positive symptoms significantly decreased with increasing age longitudinally, while B) non-perceptual positive symptoms increased with increasing age. The bar underneath the age plot reflects the derivative of the slope, i.e., the rates of change taking place at a particular age, scaled as a pseudo t-statistic, based on the posterior simulation. The dotted lines indicate when significant age associated change is taking place. Brighter red indicates greater age-related increases, while bright blue indicated greater age-related decreases.
