
Fig. 8. Evolutionary Trace analysis of the DNA-PKcs protein family.
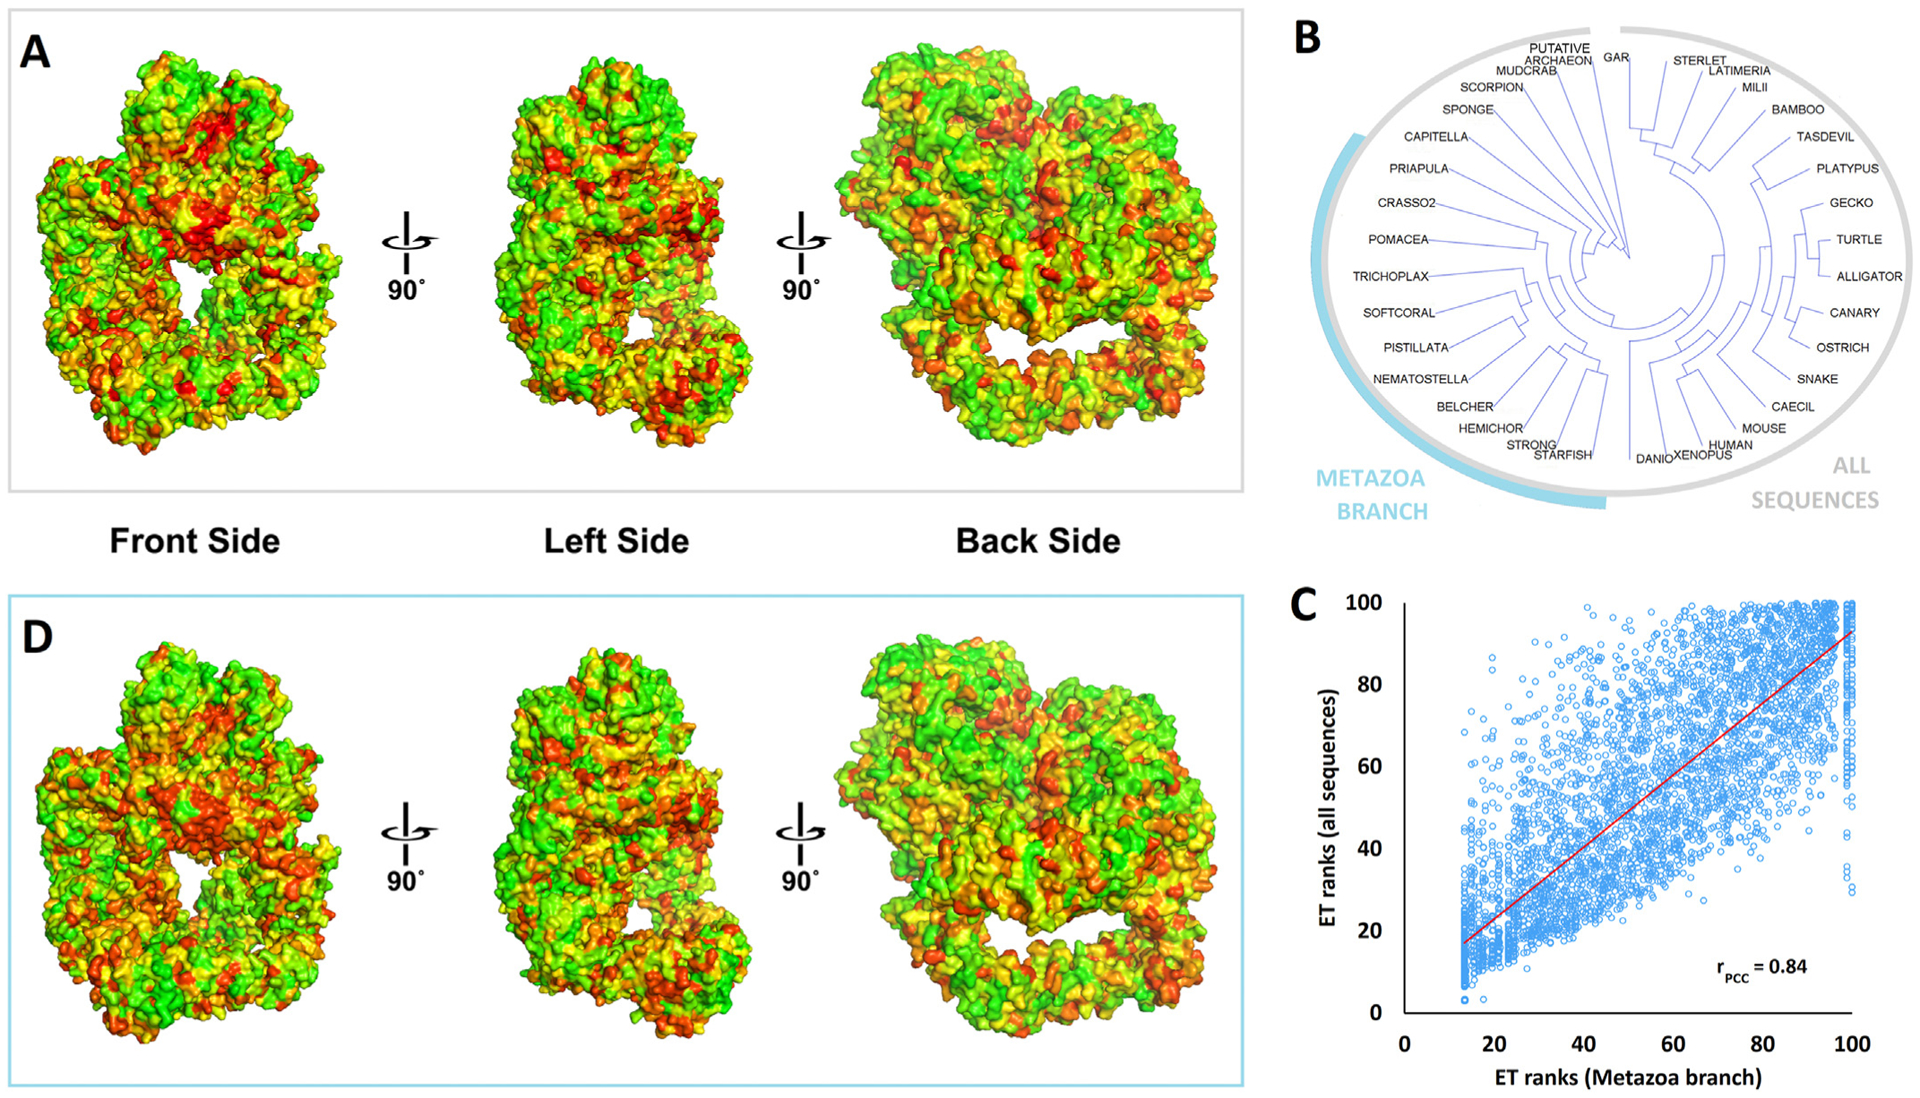
Panel A: The evolutionary importance of the DNA-PKcs residues was estimated by the Evolutionary Trace (ET) algorithm using as input the sequences alignment of Supplementary Fig. 9 (selected metazoan/vertebrates plus invertebrates and putative archaeon). The results are represented by a color scale from red (most important) to green (least important). The three viewpoints differ for about 90° and show the FAT-kinase-FATC domain (crown) on the top.
Panel B: The phylogenetic tree of the sequences found in Supplementary Fig. 9. A branch of closely related metazoan sequences was highlighted cyan. The phylogenetic tree was output of the ET algorithm and it was visualized using Archaeopteryx (version 0.9901).
Panel C: The correlation of ET ranks generated for all sequences shown in panel B versus the ET ranks generated for the metazoan branch highlighted in panel B. The Pearson’s correlation coefficient r was calculated to be 0.84.
Panel D: The ET ranks of the DNA-PKcs residues using as input the sequence alignment of the metazoan branch highlighted in panel B (same color scale and viewpoints as in panel A).
The figure panels A and D were generated by PyMol, using the PyETV plugin (Lua and Lichtarge, 2010) and chain C of the 5y3r pdb structure.