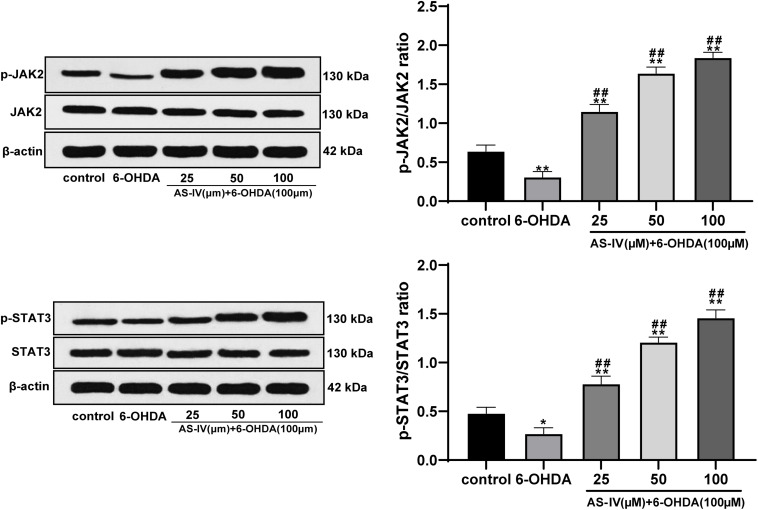
FIGURE 5.
AS-IV activated the JAK2/STAT3 pathway in 6-OHDA-treated SH-SY5Y cells. Levels of JAK2, p-JAK2, STAT3, and p-STAT3 were detected using Western blot analysis. Each experiment was repeated for three times independently. Data are presented as mean ± standard deviation. One-way ANOVA was employed for the comparisons among multiple groups and Tukey’s multiple comparison test was applied for the post hoc test, ∗p < 0.05, ∗∗p < 0.01 vs. control group; ##p < 0.01 vs. 6-OHDA groups.

