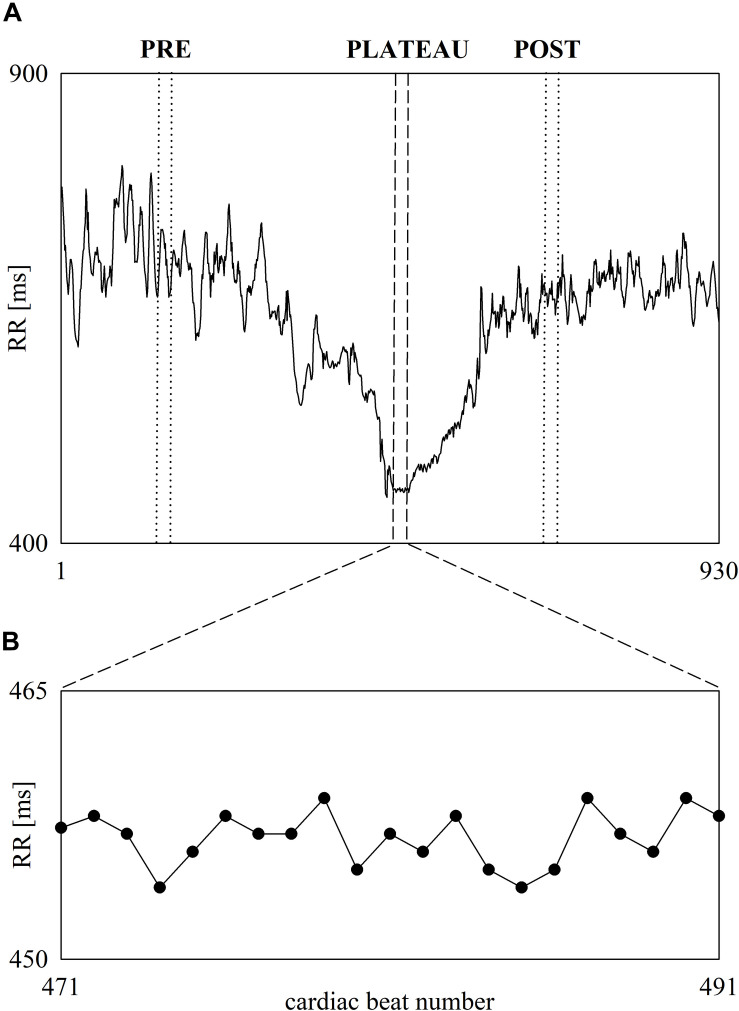
FIGURE 3.
The line plot (A) shows an example of beat-to-beat RR dynamic recorded in one subject before, during and after 60-m maximal sprint. RR oscillates about a stable mean during standing just before the onset of the sprint. Then, the RR progressively shortens during the sprint and stabilizes during PLATEAU. Finally, RR starts lengthening and, then, oscillates about a stable mean value when the recovery is concluded. The vertical short-dashed lines denote the onset and the offset of the PLATEAU. The vertical dotted lines denote the onset and the offset of the selected sequences during PRE and POST phases of the same length as the PLATEAU. The inset shows the RR variability during PLATEAU (B).

