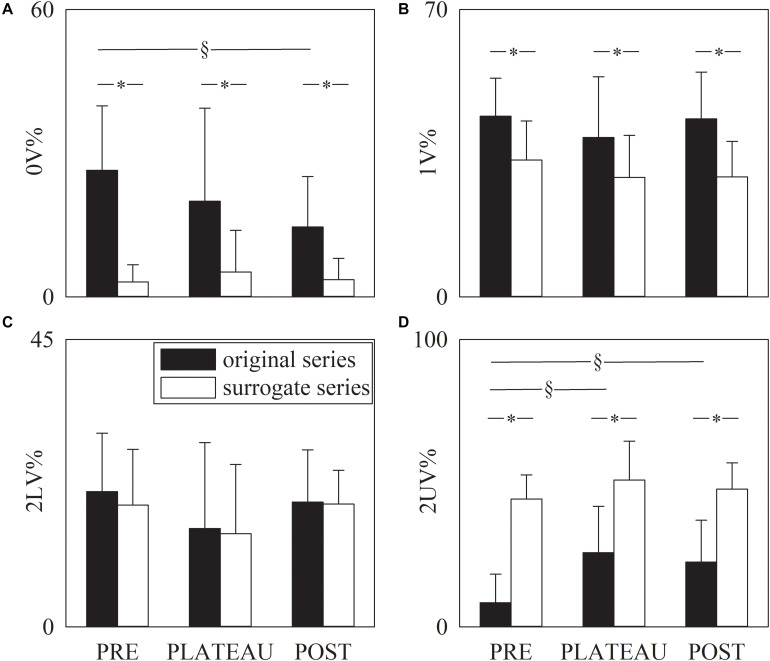
FIGURE 5.
The grouped error bar graphs show the symbolic markers, namely 0V% (A). 1V% (B), 2LV% (C), and 2UV% (D) computed over the RR series as a function of the period of analysis (i.e., PRE, PLATEAU, and POST). Indexes were calculated over original (solid black bars) and surrogate data (solid white bars). Data are reported as mean plus standard deviation. The symbol § indicates p < 0.05 across periods of analysis within the same type of series (i.e., original or surrogate sequence). The symbol * indicates p < 0.05 between types of series within the same period of analysis.

