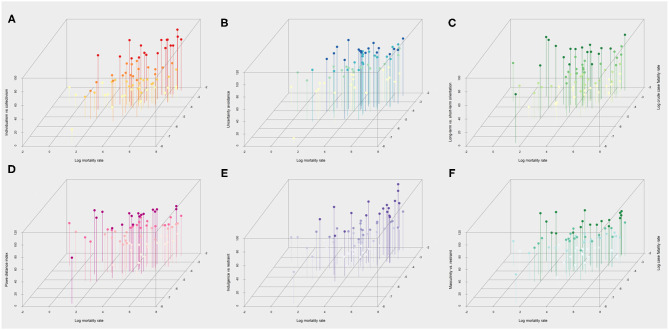
Figure 3.
Scatterplots of the six cultural dimensions the two measures of fatality over the first wave up to September 20, 2020. Scatterplots of Hofstede cultural dimensions (y-axis) vs. log transformed mortality (x-axis) and case fatality risk (z-axis) across 73 countries included in the analysis. Higher values on the y-axis indicate a higher degree of (A) individualism (vs. collectivism), (B) uncertainty avoidance (vs. comfort with uncertainty), (C) tendency for long-term orientation (vs. short term), (D) power distance (a greater level of hierarchy), (E) indulgence (vs. restraint) (F) masculinity (vs. femininity) in society. The colored shading ranks each observation from high to low for each cultural dimension using four ordinal categories. For instance, darker shades in the (A) indicates greater level of individualism vs. collectivism.

