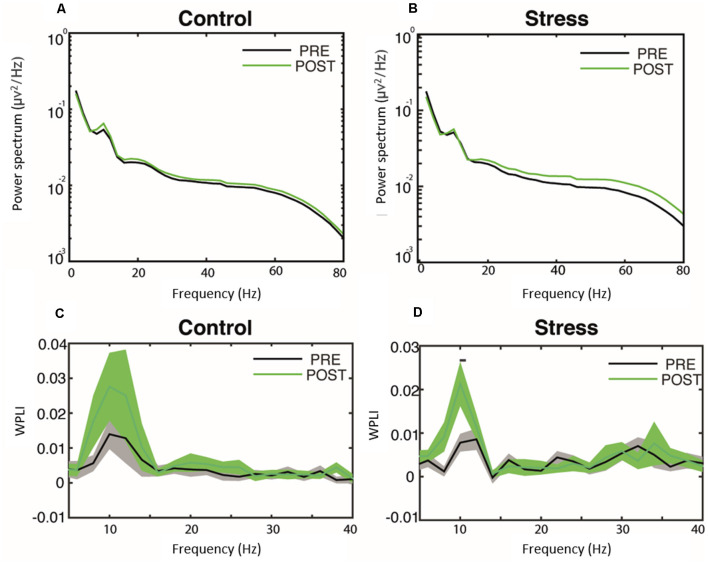
Figure 2.
Effect of psychosocial stress over oscillatory activity during resting state. Power spectrum (A,B) and phase synchrony through the WPLI (C,D) during baseline and after either the control protocol (A–C) or the TSST (B–D). The black line over the WPLI spectra in (D) indicates p < 0.05, permutation test corrected by multiples comparisons. Solid lines and shaded areas illustrate mean and SEM, respectively. The baseline measurement is named ‘pre’. WPLI, Weighted Phase-Lag Index.

