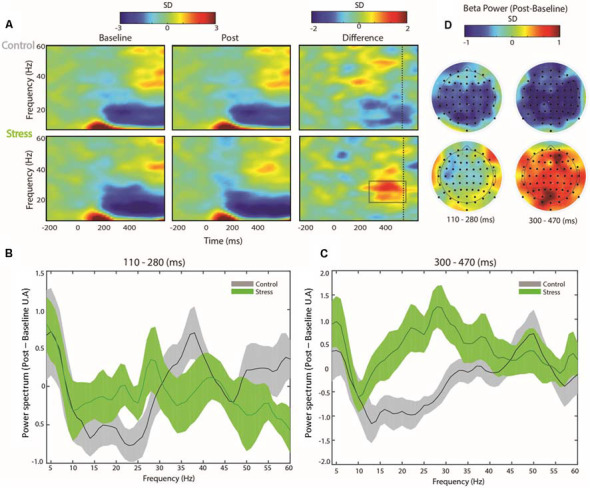
Figure 3.

Oscillatory activity associated with correct trials of control and stressed participants. (A) Time-frequency charts of correct trials for both groups during baseline and after the control protocol (top) or the TSST (below). The grey square indicates the region in which one difference chart is significantly higher than the other (permutation test corrected by multiple comparisons using a clustering method, Maris and Oostenveld, 2007). The difference chart indicates the spectral power subtracting post spectrograms less baseline. Vertical dashed lines show the mean reaction time. (B) Spectrograms of the post-baseline early ( 0.11–0.28 s) and (C) late ( 0.3–0.47 s) correct trial differences. (D) The topography of the post-treatment beta power (22–28 Hz) less baseline beta power for the control (top) and stress participants (below) during the first (left topographies) and second half (right topographies) of the correct trial.
