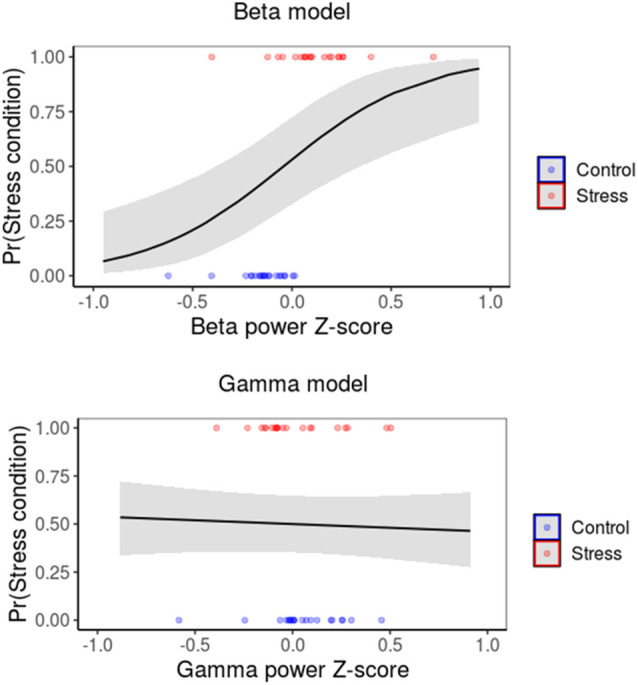
Figure 5.

A model including Beta-band and Gama-band power as the covariate. The probability of the stress group occurrence is given by Beta-band or Gamma-band power. The colored points represent the beta or gamma normalized power from each participant performing the task after the TSST or control protocol (red and blue, respectively).
