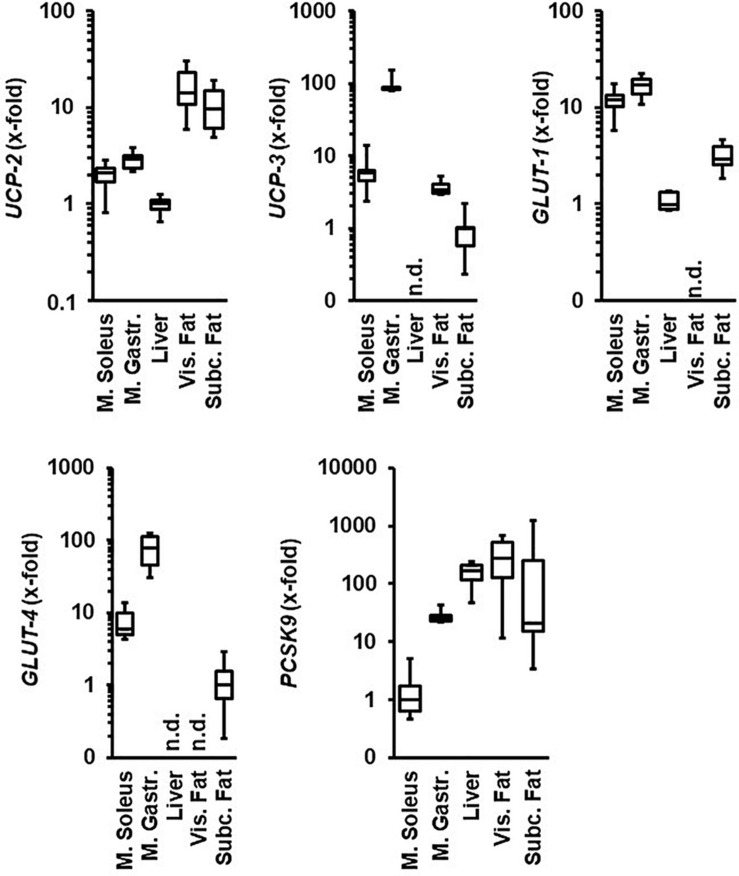
FIGURE 1.
Comparison of the tissue-specific mRNA expression of genes under investigation. Tissue samples are from normotensive rats (age 11.5 months). Expression analysis is normalized to B2M in all samples. The tissue with the lowest expression is always set as 1. Data are box plots representing the 25, 50, and 75% quartile and the whiskers representing the total range. n.d., not detectable.

