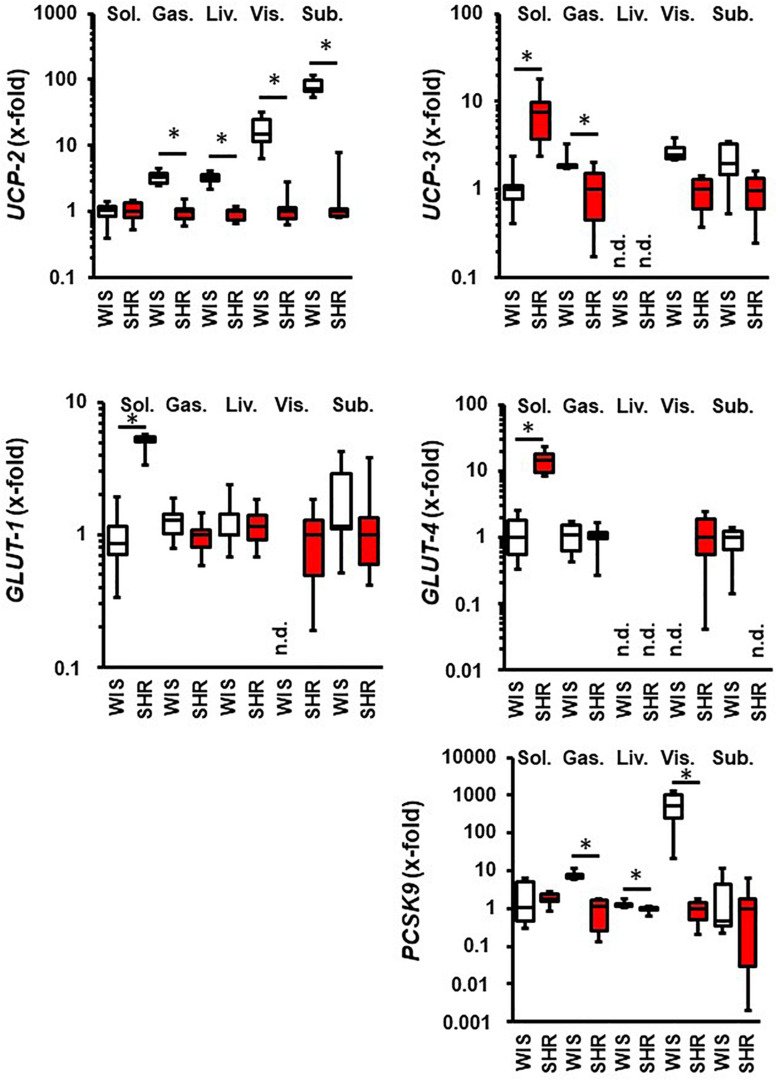
FIGURE 2.
Comparison between 11.5 months old normotensive rats (WIS; white boxes) and spontaneously hypertensive rats (SHR, red boxes). Strain with lowest expression was always set at 1. Data are box plots representing the 25, 50, and 75% quartile and the whiskers representing the total range. n.d., not detectable. ∗p < 0.05 between strains.

