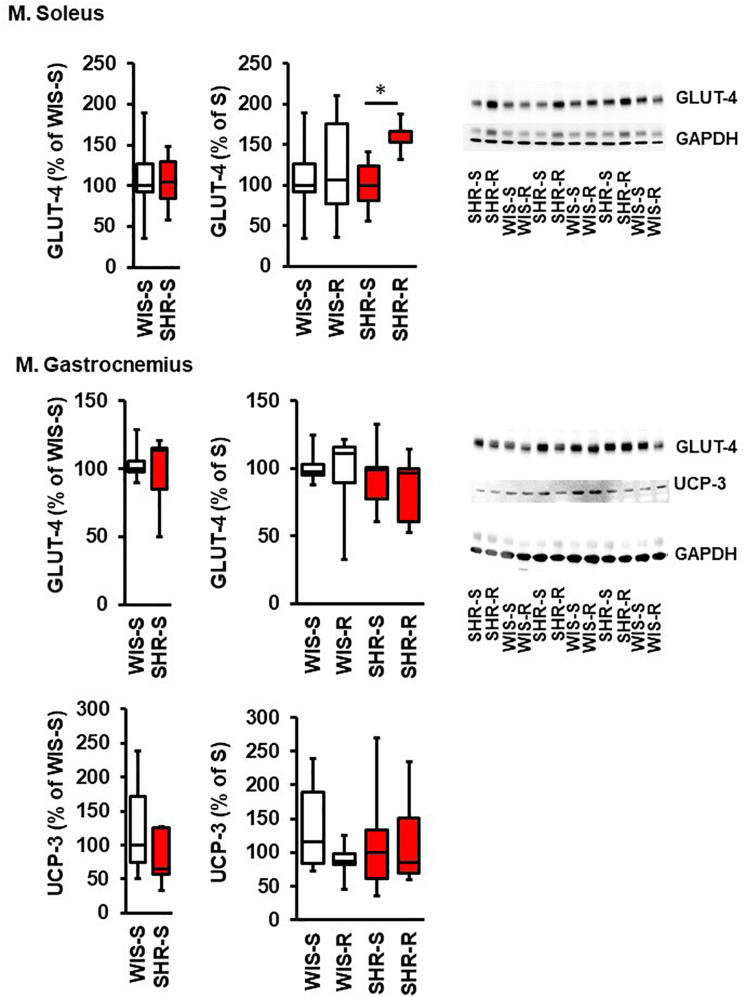
FIGURE 5.
Effect of free running wheel activity (R) on protein expression in muscle tissue and comparison between both strains. Sedentary controls (S) for each strain set as 100%. Data are box plots representing the 25, 50, and 75% quartile and the whiskers representing the total range. Original immunoblots are also shown. Data represent UCP3 and GLUT-4 expression normalized to GAPDH controls at the age of 11.5 months of exercise. n.d., not detectable. ∗p < 0.05 vs. sedentary (sed).

