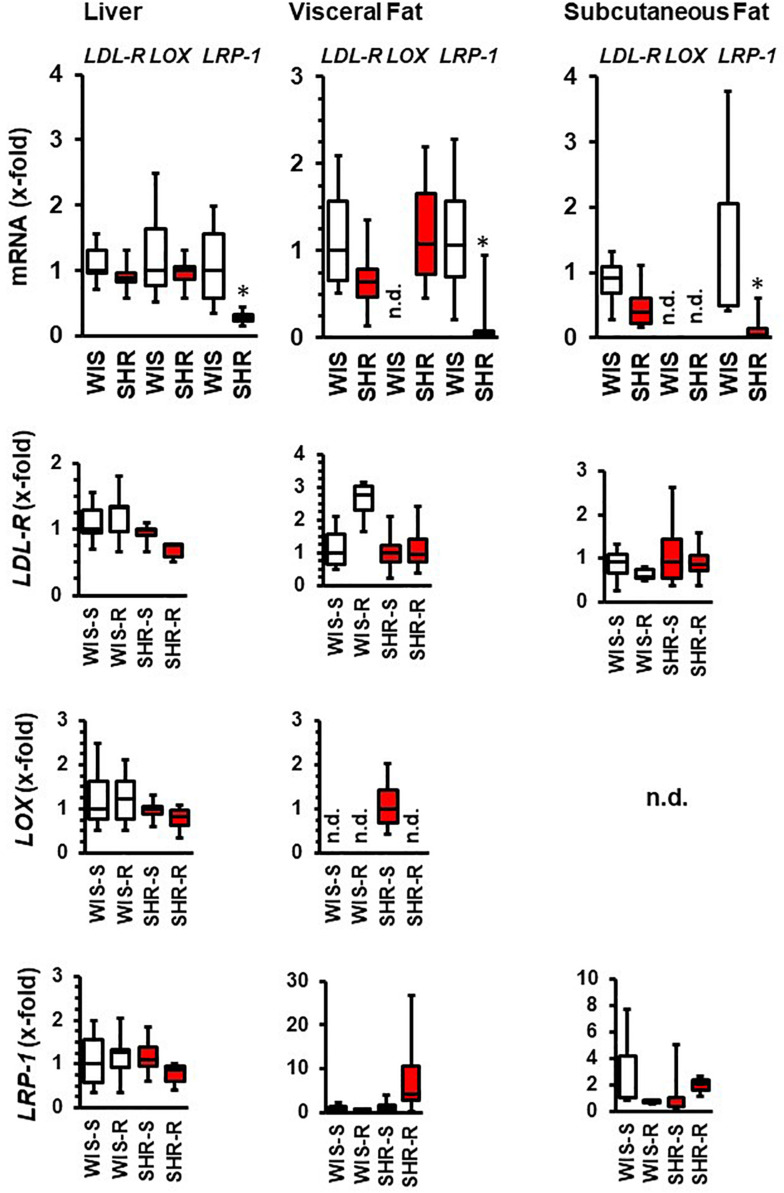
FIGURE 7.
mRNA expression of cholesterol transporters in liver and fat tissue from both strains and the effect of free running wheel activity (R) in comparison to sedentary controls (S). Data are box plots representing the 25, 50, and 75% quartile and the whiskers representing the total range. ∗p < 0.05 vs. sendentary (sed).

