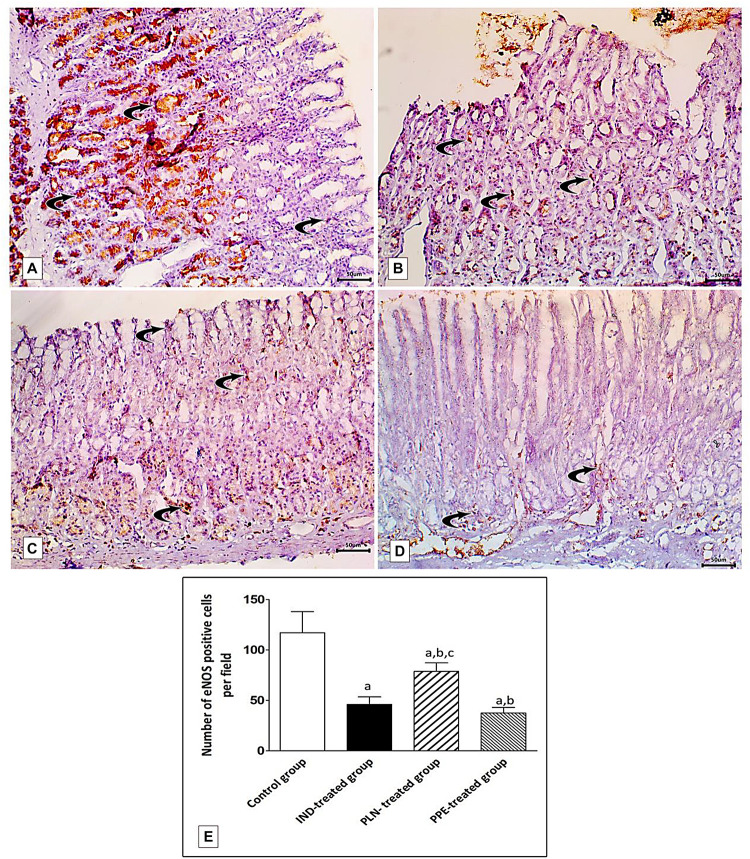
FIGURE 13.
Photomicrographs of immunohistochemical staining of e-NOS in fundic mucosa showing: (A) the control group showing highly positive strong expression of e-NOS in glandular epithelial cells and in blood capillaries in the lamina propria (curved arrow). (B) IND-treated group showing weak positive expression confined mainly in blood capillaries of the lamina propria (curved arrows). (C) PLN-treated group showing moderate positive expression in the vascular endothelium, surface epithelium and glandular epithelial cells (curved arrow). (D) PPE-treated group showing weak positive expression more prominently in the vascular endothelium of the lamina propria (curved arrow) (Immunostaining for eNOS × 200, scale bar = 50 μm). (E) quantitative analysis of the mean count of e-NOS immunopositive cells in the fundic mucosa of the studied groups. Data are presented as mean ± SD. Kruskal-Wallis H test followed by the Mann-Whitney U tests were used for analyzing the results. asignificant as compared to the control group (p ≤ 0.05). bsignificant as compared to IND-treated group (p ≤ 0.05), csignificant as compared to PPE-treated group (p ≤ 0.05).

