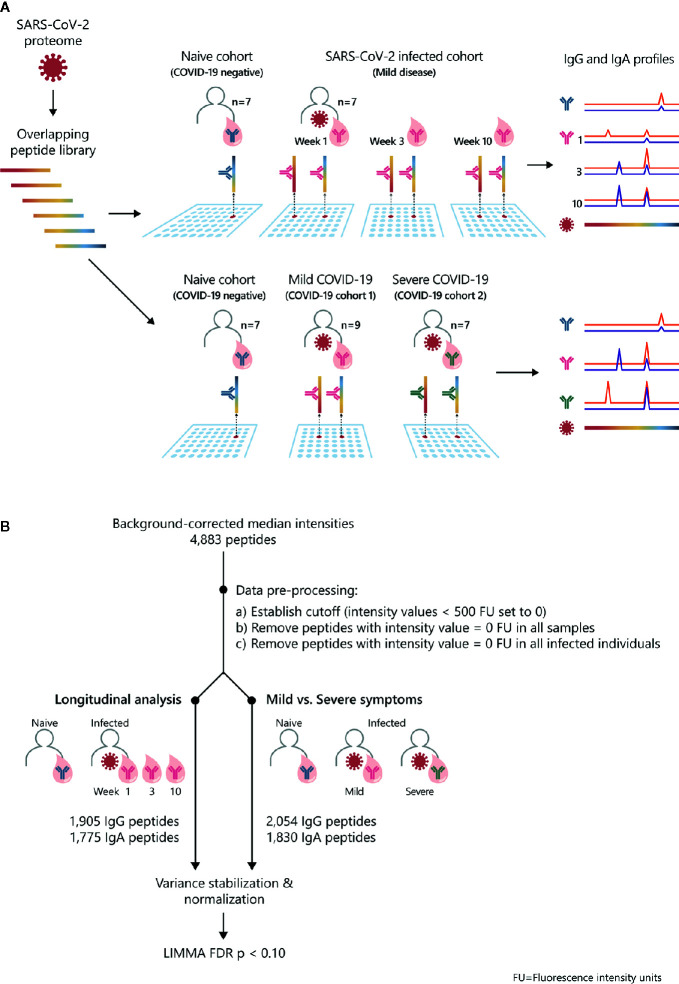
Figure 1.
Study overview and statistical analysis workflow: SARS-CoV-2 proteome-wide IgG and IgA epitope mapping. (A) The proteome of SARS-CoV-2 was translated in 15-mer overlapping peptides with a peptide-to-peptide overlap of 13 amino acids. The resulting 4,883 individual peptides were printed in duplicates on the microarray. Sera from confirmed COVID-19 patients and SARS-CoV-2-naive individuals were incubated on PEPperCHIP® SARS-CoV-2 Proteome Microarrays. Serum antibody binding was visualized using respective fluorescently labeled secondary antibodies (anti-human IgG and anti-human IgA). Image acquisition and data quantification resulted in epitope-specific antibody profiles for SARS-CoV-2. (B) The statistical analysis was performed in the R language (version 4.0.2). Data quantification resulted in background-corrected median fluorescence intensity values (raw data) which were subjected to the following pre-processing steps: (i) signals below 500 FU (fluorescence units) were set as zero, (ii) peptides with 0 FU in all individuals were removed and (iii) peptides with 0 FU in all infected individuals were removed. For the longitudinal analysis, the applied pre-processing steps resulted in 1905 remaining peptides for IgG and 1775 peptides for IgA. For the comparison of patients with mild versus severe symptoms, the applied pre-processing steps resulted in 2054 remaining peptides for IgG and 1830 peptides for IgA. Next, the remaining filtered raw values were normalized using variance stabilizing normalization (VSN) followed by statistical analysis based on the LIMMA algorithm. The false discovery rate (FDR) was controlled at a p-value < 0.1 using Benjamini Hochberg procedure.

