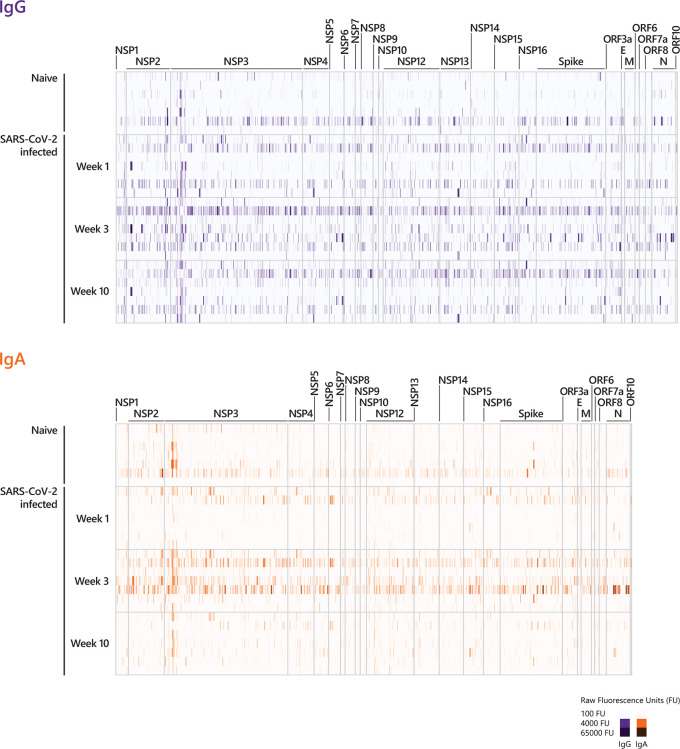
Figure 2.
Longitudinal IgG and IgA epitope-specific antibody profiles in COVID-19 patients. For visualization purposes, the heat-maps show the epitope recognition profile for a selected number of peptides (IgG and IgA antibody profiles across the entire proteome are presented in Supplementary Figure S1 ). The selection of peptides was performed applying the following pre-processing criteria: (i) signals below 500 FU (fluorescence intensity units) were set to zero and (ii) peptides with 0 FU in all individuals were removed. This resulted in 2226 remaining peptides for IgG and 2046 remaining peptides for IgA. The heat-maps show the IgG and IgA raw fluorescence intensities for the selected, reduced number of peptides detected for each individual in the corresponding cohort. Sera taken week 1, week 3, and week 10 p.o. from COVID-19 patients with a mild disease course (n=7) and sera taken from SARS-CoV-2-naive individuals were incubated on whole-proteome peptide microarrays. The data for COVID-19 patients for all time points are shown in the following order: patient #2, #4, #3, #8, #7, #1, #10. Serum antibody binding was visualized with fluorescently-labeled secondary antibodies detecting IgG and IgA. The peptide specificities underlying Figure 2 are provided in Supplementary Table S5 . NSP, non-structural protein; E, Envelope protein; M, Membrane protein; N, Nucleocapsid Phosphoprotein.

