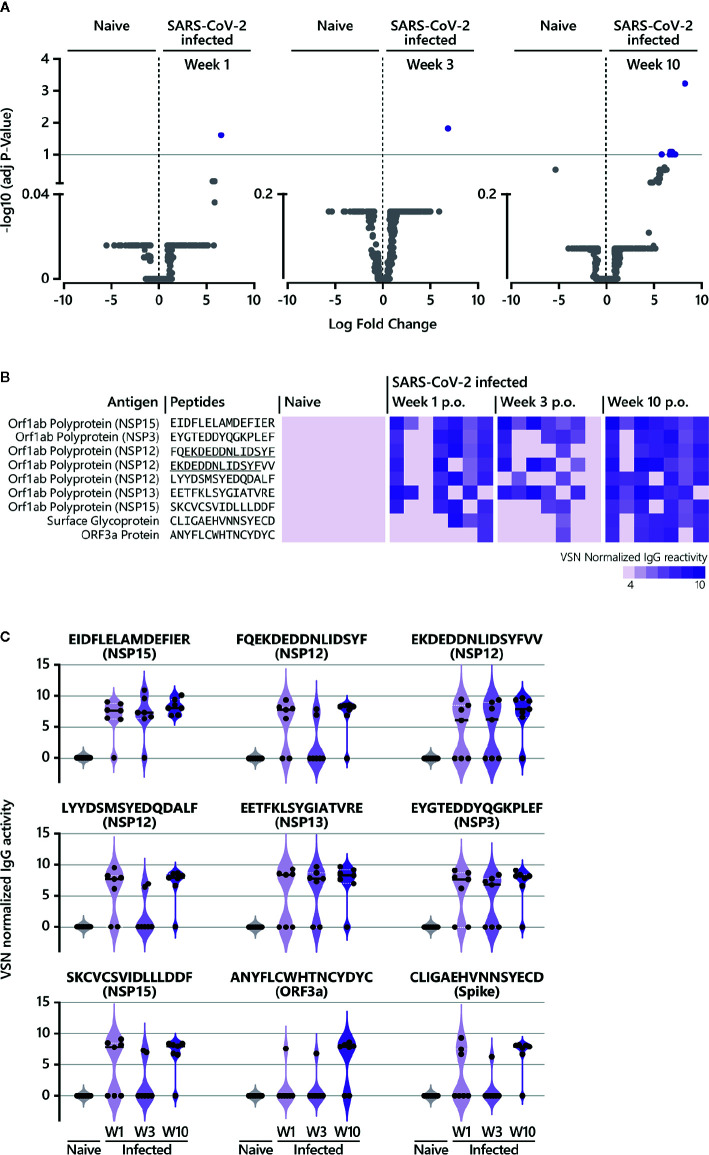
Figure 3.
Epitope-specific antibody response in COVID-19 patients over time. (A) The LIMMA package was used to determine significant differences in epitope recognition comparing SARS-CoV-2-naive individuals and SARS-CoV-2-infected individuals at different time points p.o. Volcano plots are shown for the comparison between SARS-CoV-2-naive and SARS-CoV-2-infected individuals week 1, week 3, and week 10 p.o., respectively. Volcano plots are depicted with the Log fold change of the intensity of each peptide (x-axis) versus the negative log10 FDR adjusted p-value (y-axis). The Log fold change of a certain peptide is the mean difference in value between the respective groups that are compared. An FDR below < 0.1 was considered as statistically significant. Each dot in the volcano plot represents one peptide. The purple highlighted data points indicate peptides identified for IgG that are significantly recognized in SARS-CoV-2-infected individuals. The grey dots represent peptides that did not reach statistical significance. The results of the statistical analysis are provided in Supplementary Table S1 . (B) Individual IgG antibody responses to the nine peptides significantly identified in COVID-19 patients. The reactivity patterns in all cohorts (naive control group; COVID-19 patients week 1, week 3 and week 10 p.o.) are shown as heat-maps using VSN normalized values. The data for COVID-19 patients for all time points are shown in the following order: patient #2, #4, #3, #8, #7, #1, #10. Peptides underlined indicate overlapping peptides. (C) Individual IgG antibody responses to the nine peptides significantly identified in COVID-19 patients as violin plots. p.o., post symptom onset; w, week.

