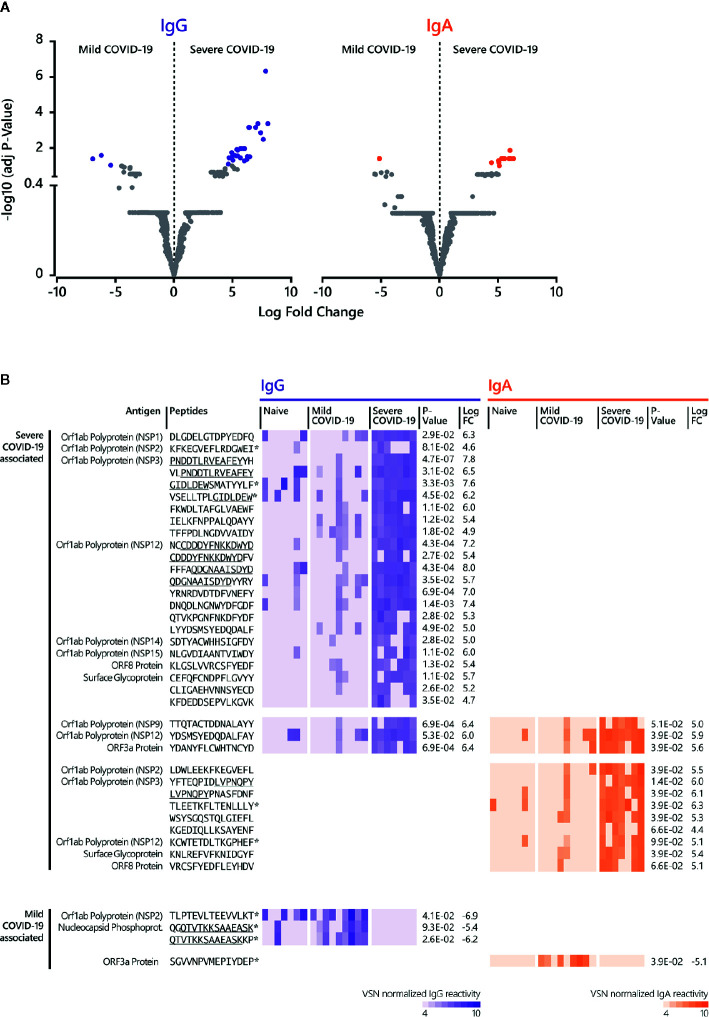
Figure 4.
Linear B cell epitopes associated with mild and severe COVID-19 disease. (A) The LIMMA package was used to determine significant differences in epitope recognition comparing mild and severe COVID-19 disease. Volcano plots are shown for the comparison between mild and severe COVID-19 disease for IgG and IgA. Volcano plots are depicted with the Log fold change of the intensity of each peptide (x-axis) versus the negative log10 FDR adjusted p-value (y-axis). The Log fold change of a certain peptide is the mean difference in value between the respective groups that are compared. An FDR of < 0.1 was considered as statistically significant. Each dot in the volcano plot represents one peptide. The purple (IgG) and orange (IgA) highlighted data points indicate epitopes that are significantly recognized. For IgG, the right-side purple dots correspond to significant severe disease-specific peptides and the left-side purple dots correspond to significant mild disease-specific peptides. For IgA, the right-side orange dots correspond to significant severe-specific peptides and the left-side orange dot correspond to one significant mild-specific peptide. The grey dots represent peptides that did not reach statistical significance. (B) Individual antibody responses to peptides significantly associated with mild and disease severity. The reactivity patterns in all cohorts (naive control group, COVID-19 patients with mild and severe disease) and for both isotypes are shown as heat-maps using VSN normalized values. Underlined peptides indicate overlapping peptides. * indicates no significant discrimination from the naive control group. Adjusted p-value for the comparison between mild and severe disease cohort and Log fold change (LogFC) between mild and severe disease cohort was determined by LIMMA analysis. The results of the statistical analysis are provided in Supplementary Tables S3 and S4 .

