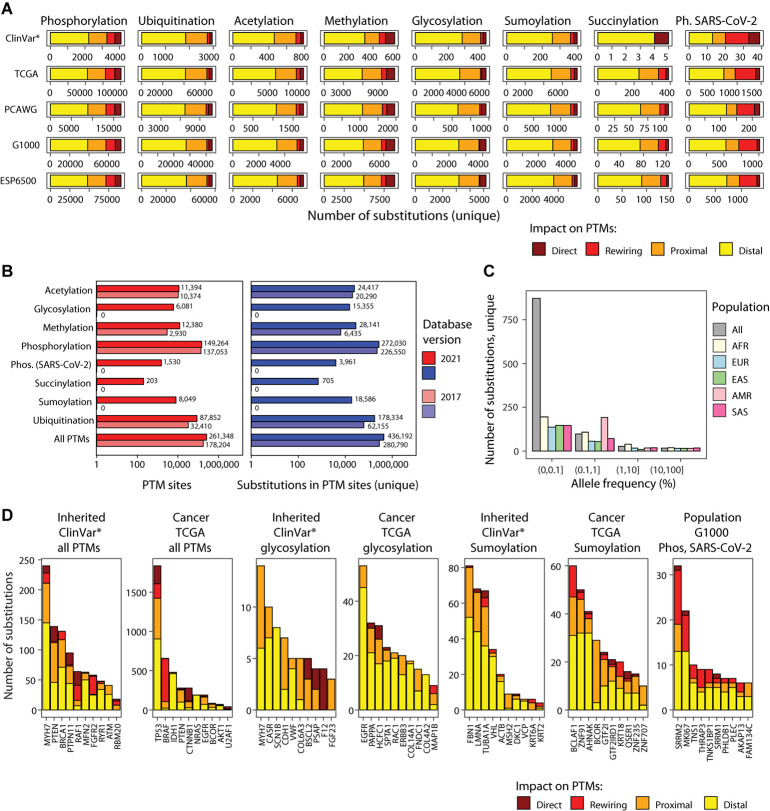
FIGURE 2.
PTM sites and mutations in ActiveDriverDB. (A) Summary of genetic variants (i.e., amino acid substitutions) affecting PTM sites in the database. Eight types of PTM sites are shown as horizontal stacked bar plots (left to right) with five genome variation data-stes (top to bottom): interited disease mutations (*ClinVar: only pathogenic and likely pathogenic variants), somatic cancer mutations (TCGA, PCAWG) and human population variation (1000 Genomes, ESP6500). Colors indicate the predicted impact of substitution on PTM sites. Total numbers of unique PTM-associated substitutions in consensus protein isoforms are shown. (B) Bar plot shows counts of PTM sites and relatedd substitutions in ActiveDriverDB. The current and previous versions of the database are compared. (C) Allele frequency of substitutions in the human population (1000 Genomes) affecting the phosphosites modulated by the SARC-CoV-2 infection in Vero E6 cells. Population cohorts are shown in colors (AFR, African; Admixed American; EAS, East Asian; EUR, European; SAS, South Asian). (D) Top genes with PTM-related substitutions in all PTM sites in inheried disease and cancer, genes with glycosylation and sumoylation-associated subtitutions, and top genes in the human population with SARS-CoV-2-specific phosphosites affected by substitutions. Colors indicate the predicted impact of substitutions on PTM sites. Genes were prioritized using ActiveDriver (FDR < 0.05), except for the rightmost group where unique substitution counts were used.

