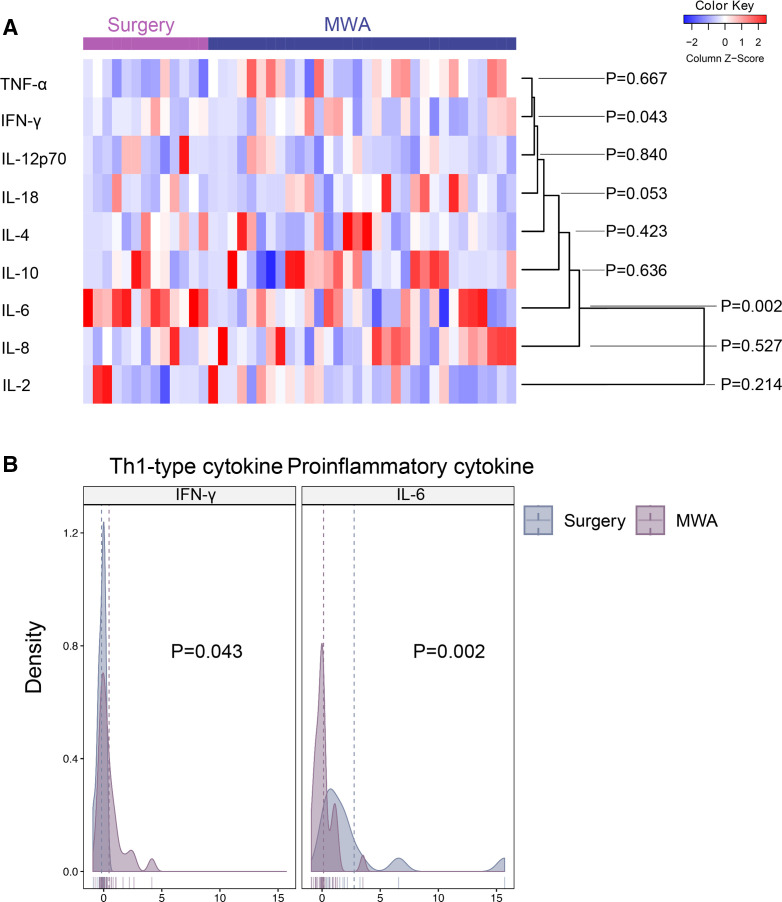
Figure 2.
Changes in peripheral cytokines induced by MWA in comparison to surgery. (A) Heat map of the changes in peripheral cytokines in the MWA group (n=32) and the surgery group (n=13). (B) Scatter plots showing the changes in peripheral Th1-associated cytokine IFN-γ and proinflammatory cytokine IL-6 between the two groups. Data are presented as mean±SD. IFN-γ, interferon gamma; IL, interleukin; MWA, microwave ablation; TNF-α, tumor necrosis factor alpha.

