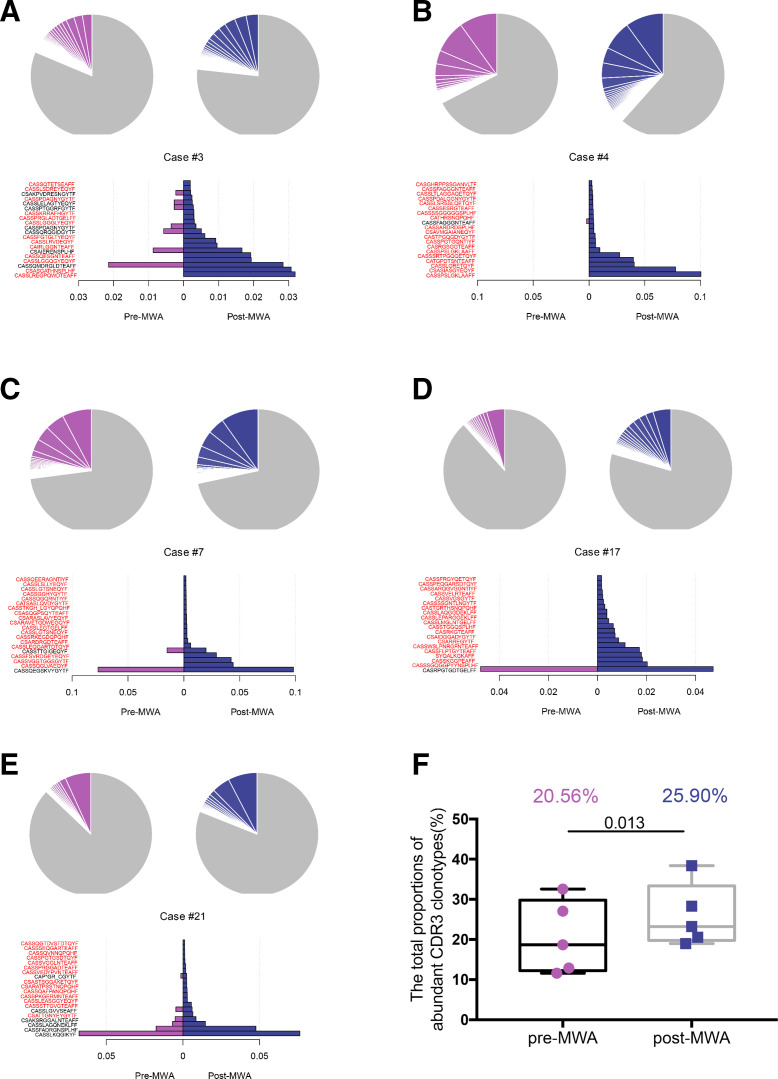
Figure 5.
Expansion of TCRβ repertoire activated by MWA.(A–E) The distribution of the abundant TCRβ CDR3 clonotypes with a frequency of 0.1% or higher is presented in pie charts (top panel) (purple: pre-MWA, blue: post-MWA, gray: portion of CDR3 clonotypes below the frequency of 0.1%). The top 20 abundant TCRβ CDR3 clonotypes newly appeared or increased after MWA (bottom panel) (purple bars: clonotypes that were rarely observed in pre-MWA samples, blue bars: top 20 abundant clonotypes observed in post-MWA samples; red: clonotypes that were completely absent in pre-MWA samples). Representative of five patients. (F) The total proportion of the abundant TCRβ CDR3 clonotypes with the frequency of 0.1% or higher was significantly increased after MWA (n=5). MWA, microwave ablation; TCRβ, T-cell receptor β

