Figure 5.
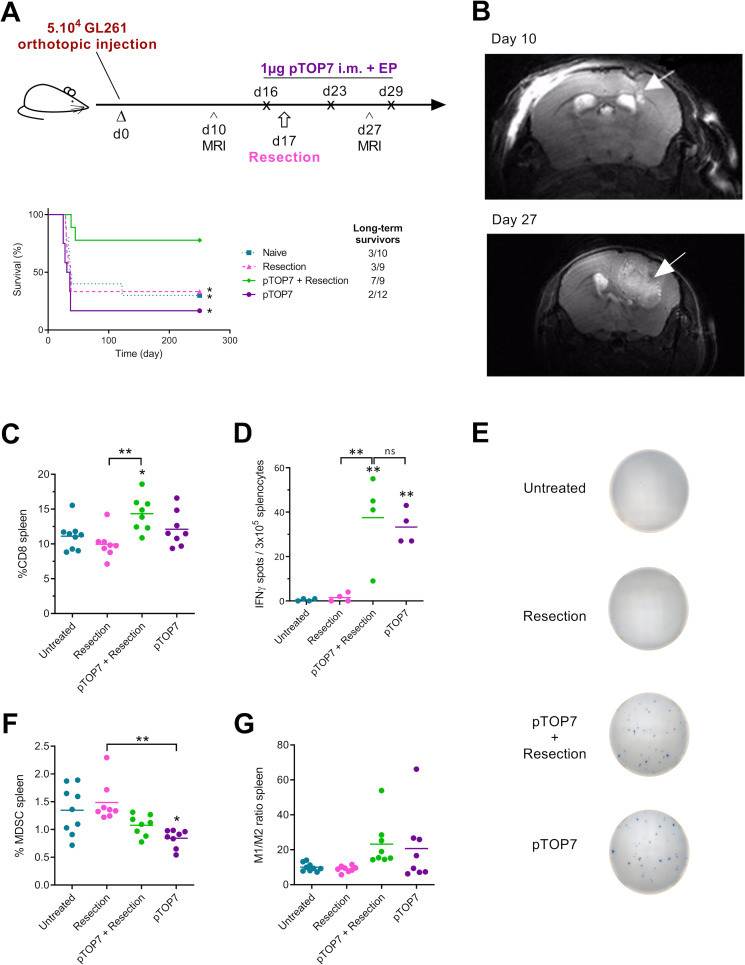
Therapeutic immunization and resection in an orthotopic glioblastoma model and development of the systemic immune response. (A) Schematic protocol and survival curves for the therapeutic immunization. C57BL/6 mice first received an intracranial injection of GL261 cells at day 0. MRI was used to monitor brain tumors on days 10 and 27. The pTOP vaccine was intramuscularly electroporated 16, 23 and 19 days after the injection of tumor cells, and resection of the tumor was performed on day 17; n=9–12. (B) representative axial T2-weighted MRI image of an untreated (naïve) mouse brain before (day 10) and after tumor resection (day 27). The white arrows indicate the GL261 primary and recurrent tumors. (C–H) analysis of immune cells in the spleen 29 days after GL261 inoculation. The percentage of CD8 T cells is shown for all the groups (C), and the production of IFNγ by splenocytes stimulated with TRP2 peptide was assessed by ELISPOT (D, E). The percentage of MDSCs (F) and the ratio of M1/M2 macrophages (G) are displayed. The error bars represent the mean±SEM; n=7–9. Statistical analysis: one-way ANOVA with Tukey’s multiple comparisons test or Mantel-Cox test for comparison of survival curves. *p<0.05, **p<0.01 compared with naive or to the specified group. ANOVA, analysis of variance; IFNγ, interferon-γ; ns, not significant; MDSCs, myeloid-derived suppressor cell; pTOP, plasmid to deliver T cell epitopes.

