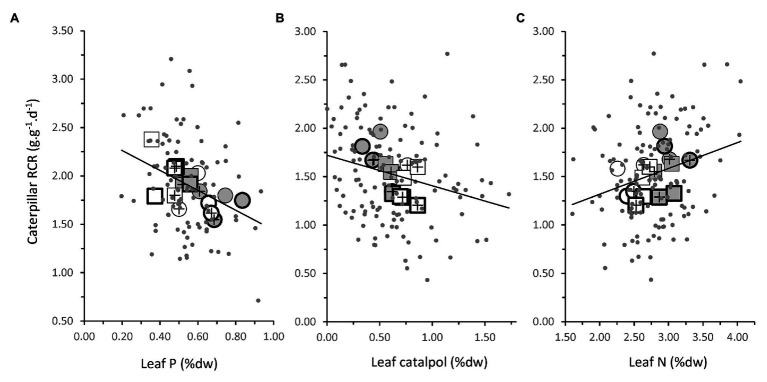
Figure 5.
Relationship between leaf traits of P. lanceolata plants and the RCR of caterpillars of M. brassicae feeding on them. (A) Leaf phosphorus concentration at the time of bioassay 1; (B) Leaf catalpol at the time of bioassay 2; and (C) Leaf nitrogen concentration at the time of bioassay 2. Gray dots represent data points for individual plants. Symbols represent treatment means. Closed symbols: plants grown under low light; open symbols: high light. Circles: plants grown under low soil phosphate; squares: high soil phosphate. Symbols with a plus sign: plants inoculated with AMF; no plus sign: without AMF. Thick symbols: plants challenged by jasmonic acid application 48 h. prior to bioassays, thin symbols: no jasmonic acid application. Lines are slopes from linear regressions (all p < 0.05). Note that the values along the leaf catalpol axis are square-root transformed values.

