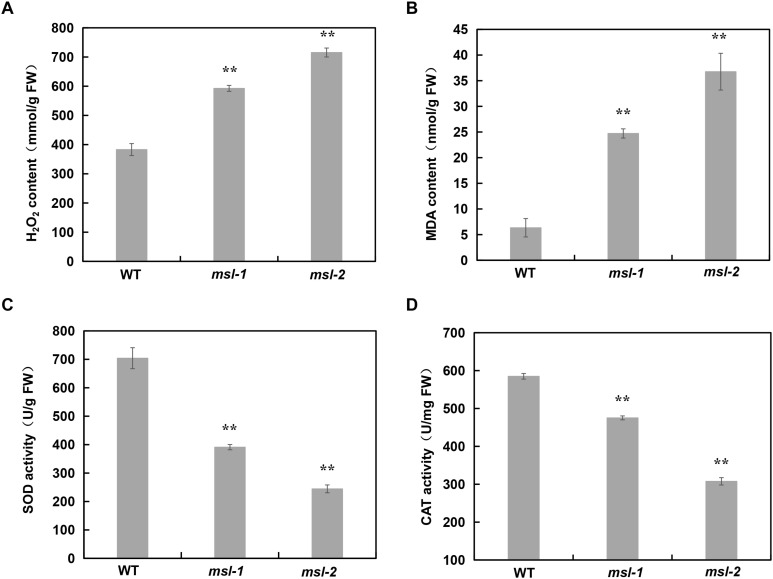
FIGURE 3.
Analysis of ROS accumulation and relative expression of antioxidant enzymes in wild type and mutants. (A) H2O2 contents. (B) Malondialdehyde (MDA) contents. (C) SOD enzyme activity. (D) CAT enzyme activity. Error bars represent the standard deviations of three biological replicates. **, significant differences at P < 0.01 (Student’s t-test).

