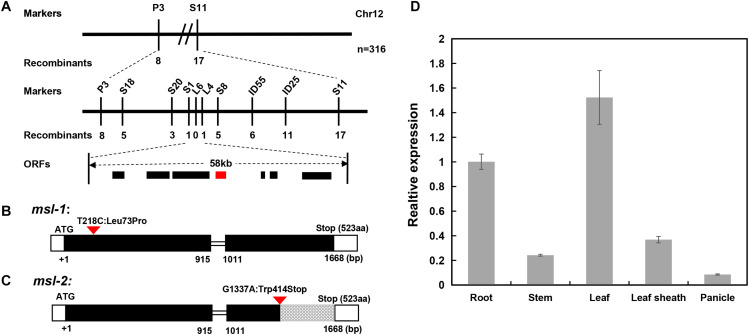
FIGURE 4.
Map-based cloning of msl-1 and msl-2. (A) The msl-1 and msl-2 loci were fine-mapped to 58kb region between Indel markers S1 and L4 on chromosome 12. (B) Gene structure of LOC_Os12g16720 and the mutation site in msl-1. (C) Gene structure of LOC_Os12g16720 and the mutation site in msl-2. The black rectangles represent exons and the red inverted triangle represents the mutation sites. (D) Analysis of SL gene expression in different tissues of WT. Error bars represent the standard deviations of three biological replicates.

