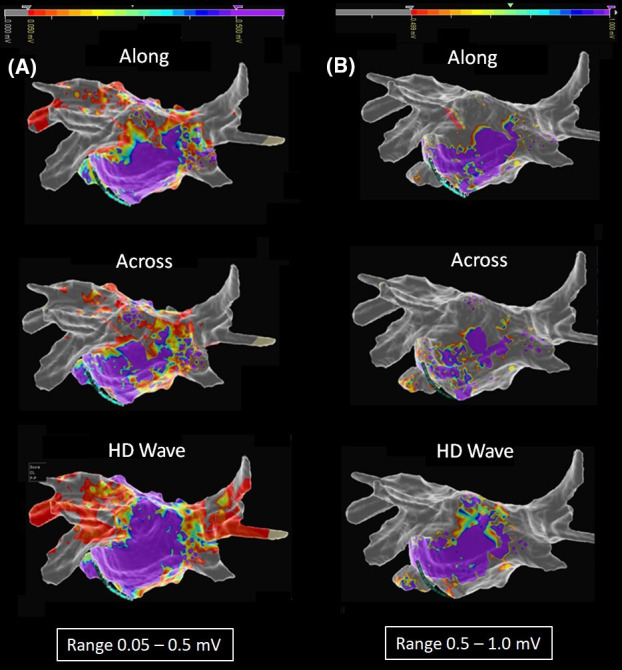
FIGURE 3.

Intra‐patient HD map: comparison of along, across, and HD‐wave maps in the two basic range. A, PA projection. Qualitative analysis after setting 0.05‐0.5 mV voltage range. Bipolar maps in along and across configuration showed LVZs in the posterior wall, which we considered compatible with patchy fibrosis (set of different colors), while in the inferior wall only normal tissue (purple color) was observed in the along configuration and partially patchy fibrosis in the across configuration. Finally, omnipolar maps in the HD‐wave configuration showed normal tissue in both the posterior and inferior walls. Note the gray color in the bipolar map, which demonstrates PVI, and the red color in the omnipolar map, which seems not to completely prove PVI. B, Re‐evaluation after setting 0.5‐1.0 mV voltage range. The along and across bipolar HD maps showed LVZs increase, with a shift to gray (transformation from potential patchy fibrosis into scar). The HD‐wave map also showed LVZs increase, but with a shift from purple to a set of different colors (transformation from normal tissue to potential patchy fibrosis). Note PVI in both bipolar and HD‐wave maps (gray color in both)
