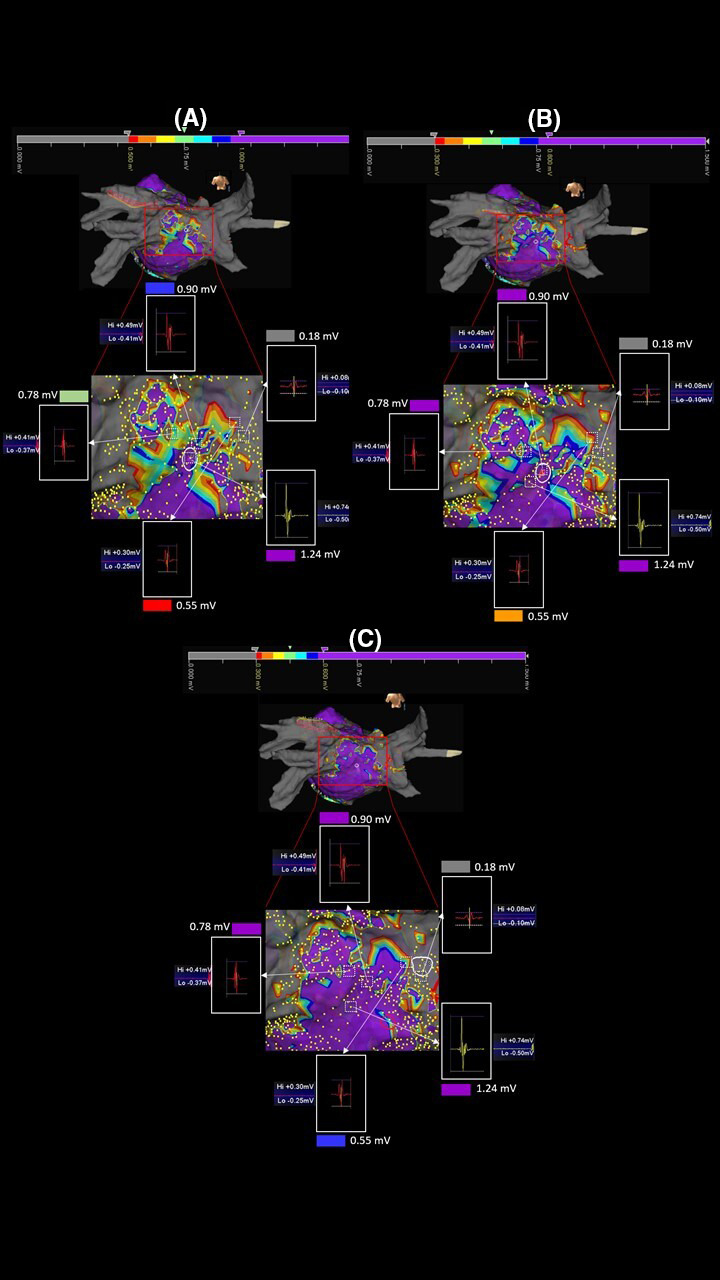
FIGURE 4.

Editing maps by changing the basic range. Maps of the same patient reported in Figure 3. Comparing the three ranges A: 0.5‐1.0, B: 0.3‐0.8, and C: 0.3‐0.6 mV, a progressive reduction of LVZs characterized by a set of red/orange/yellow/green/light‐blue/blue colors (SDC) can be noted with minimal representation in the range 0.3‐0.6 mV. The white squares with discontinuous lines and the relative white arrows identify the points under analysis. The voltage of the points is unchanged in the three maps demonstrating that the analyzed points are the same. The color change instead demonstrates a misleading identification of LVZs expression of potential patchy fibrosis in the ranges different from 0.3 to 0.6 mV
