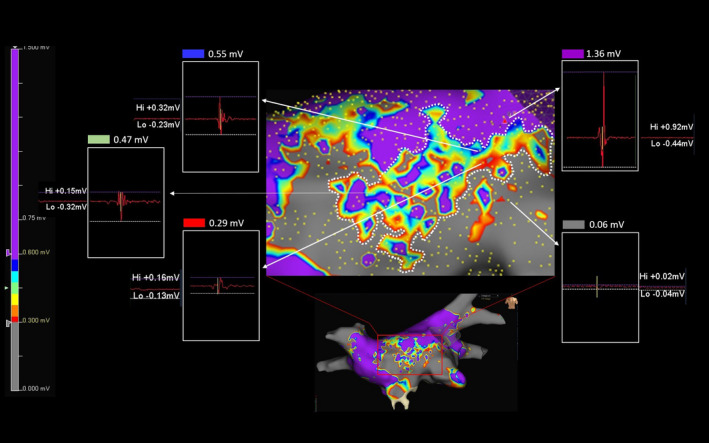
FIGURE 5.

Choice of the optimal range within which to identify potential patchy fibrosis. Magnification of a map acquired with the 0.3‐06 mV range in another patient of our series. In this case, the minimum voltage value of a gray point and maximum of a purple point in close proximity to the SDC were 0.06 and 1.36 mV, respectively, while inside the SDC minimum value was 0.29 mV (red point), intermediate value was 0.47 mV (green point), and maximum value was 0.55 mV (blue point). Note that the voltage value of each point is the sum of positive peak value (Hi) plus the negative one (Lo). Each analyzed point is identified by the white arrows. The values measured in the SDC are within the new range of 0.3‐0.6 mV we are using to identify potential patchy fibrosis
