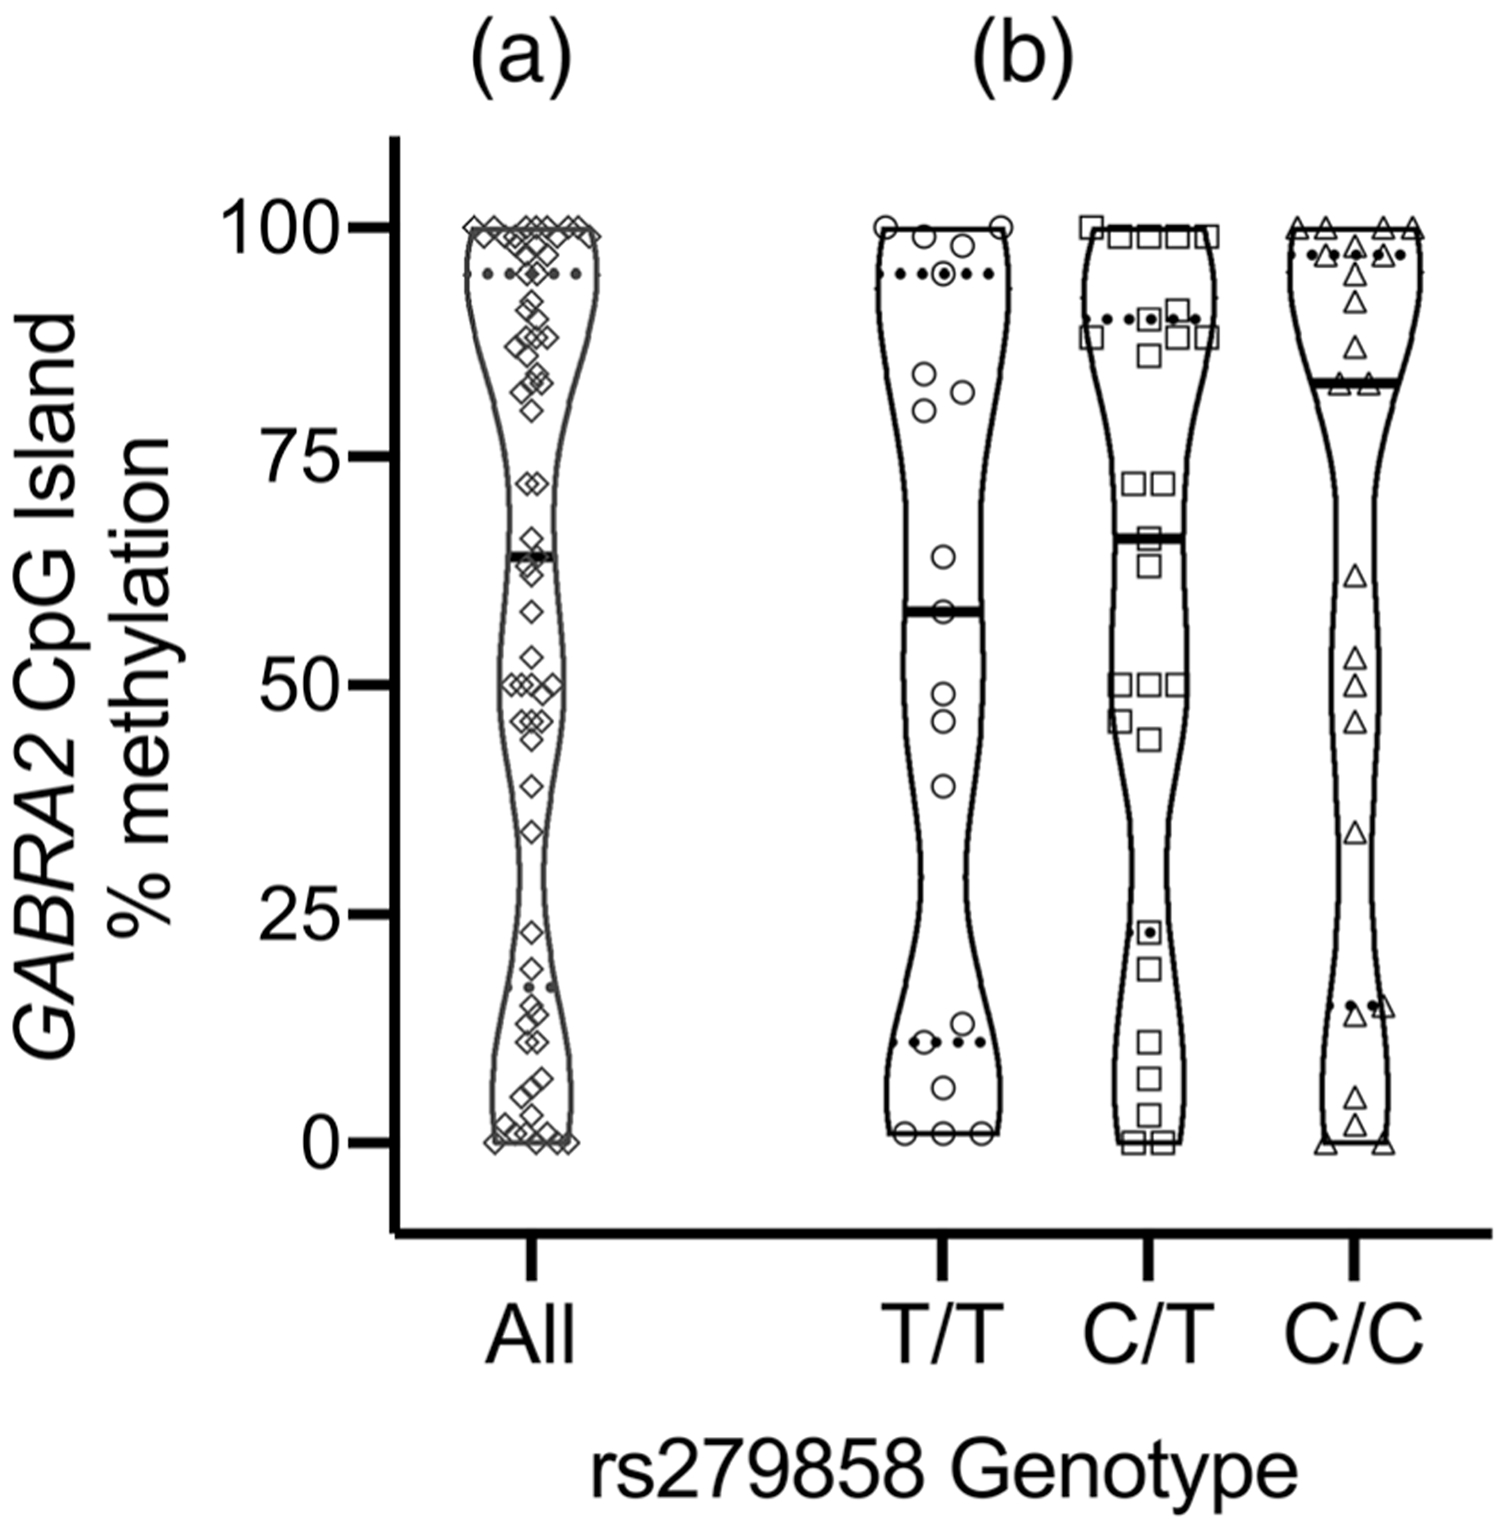
FIGURE 2.

Violin plot of GABRA2 promoter region mCpG levels for 69 iPSC clones. Panel (a) Triphasic distribution of GABRA2 methylation values with samples clustered below 25% (n = 19), between 25 and 75% (n = 19), or above 75% (n = 31). Panel (b) Violin plots of methylation stratified by rs279858 genotype. There was a nonsignificant step-wise trend for increasing levels of methylation associated with the number of alcohol use disorder (AUD)-associated C alleles. Median methylation level, represented by the black horizontal bar in each violin plot, was lowest for rs279858 T/T iPSCs (57.7%) and highest for rs279858 C/C iPSCs (82.7%). Quartiles are demarcated by dashed horizontal lines. ◊ = All sample (n = 69); ○ = T/T (n = 19); □ = C/T (n = 27); Δ = C/C (n = 23)
