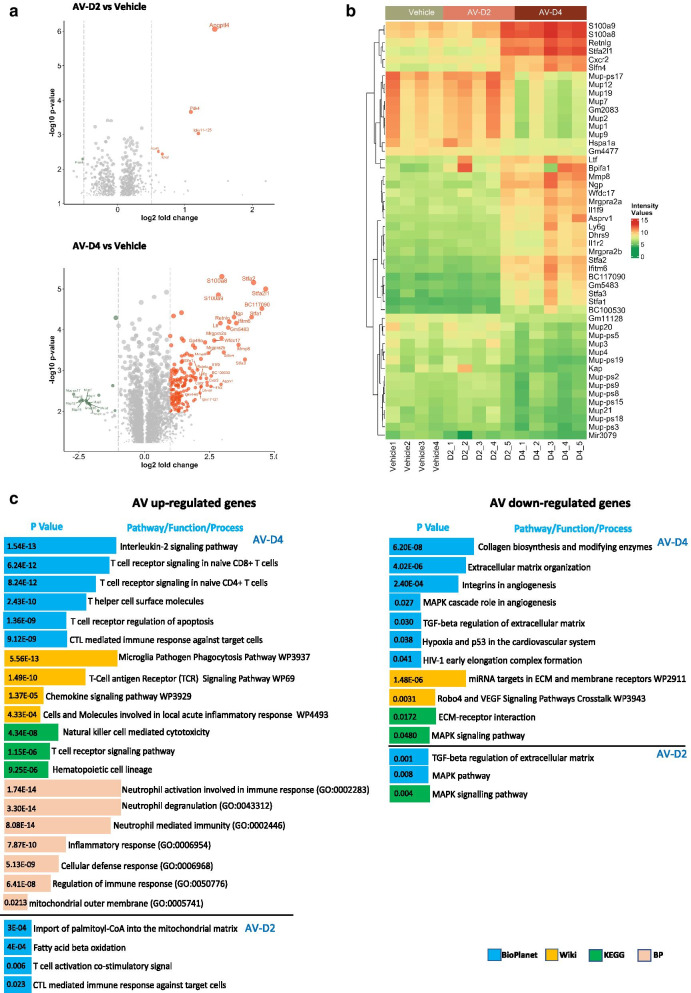
Fig. 3.
Enriched gene expression pattern of AV treatment may prevent the SARS-CoV2 infection-induced transcriptional changes a The volcano plot represents the variable expression status of genes upon AV-D2 and AV-D4 treatment in mice's lungs compared to the vehicle group. Red and green coloured dots represent up and down-regulated genes (FC > |2|, P-value < 0.05). b Heatmap represents the top 50 most variable genes in the AV-D4 group and their expression status in Vehicle, AV-D2, and AV-D4 group. c Enriched pathways and biological process in up-regulated and down-regulated genes after AV treatment compared to vehicle mice group

