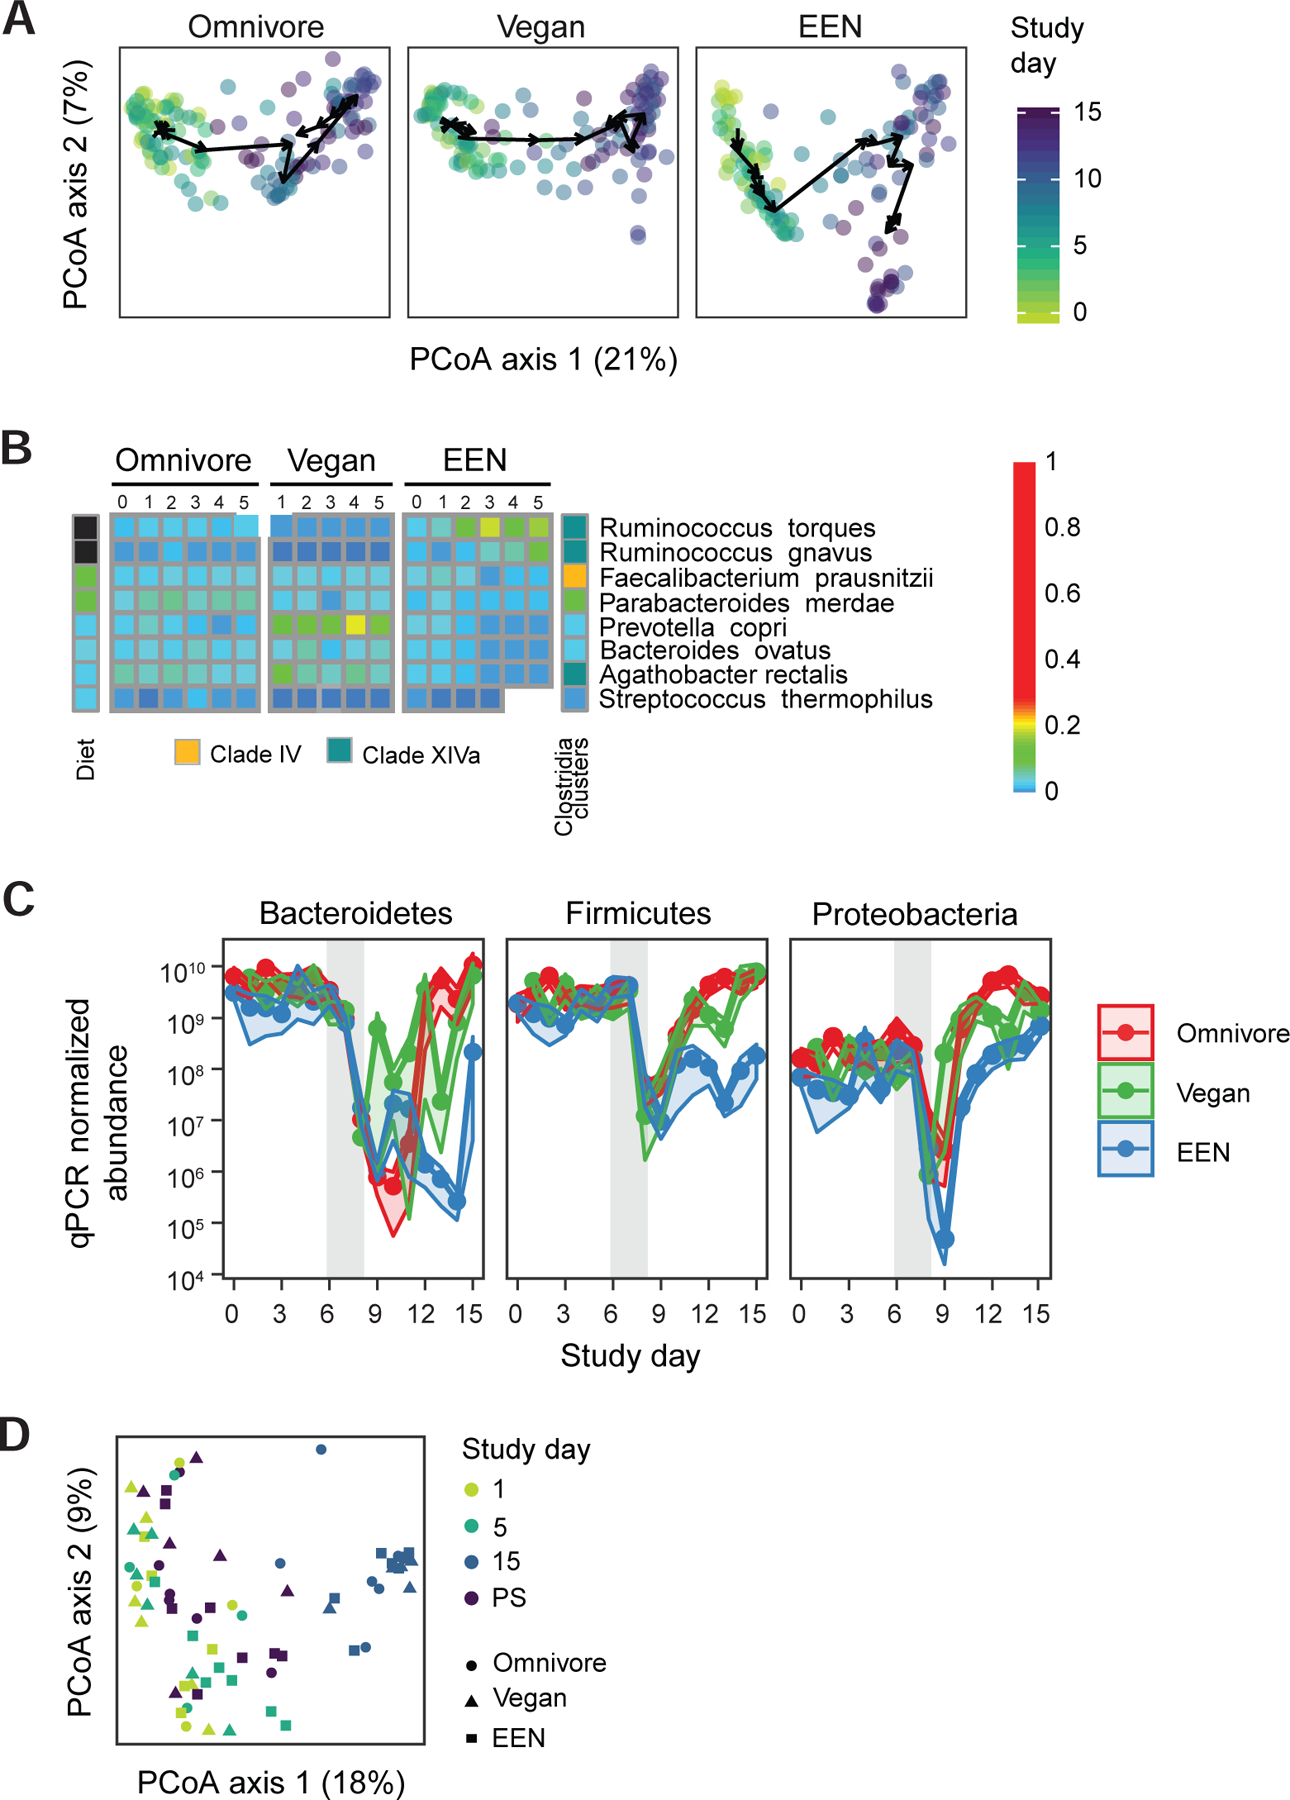
Figure 2.

Taxonomic alterations of the human gut microbiome throughout the course of the FARMM study. A) Principal coordinate analysis of Bray-Curtis distances. All three facets share the same axes and can be overlaid. The axes are labeled with the percent variance explained. The arrows connect the centroids of consecutive time points for each diet. PERMANOVA test on Bray-Curtis distances was used to assess if the microbiome communities of the diet groups are different for each day. B) The taxa that are significantly different in EEN diet compared to the omnivore diet during the diet phase based on linear mixed effects models (q<0.05). The taxa that increase during the diet phase with the EEN diet are annotated in black and the taxa that decrease in abundance are annotated with white squares. Taxa are further annotated with the Clostridia clade to which they belong. C) The qPCR corrected relative abundance of three major phyla in three diets studied. The confidence intervals represent the SEM. The gray shaded areas represent the antibiotic/PEG phase of the study. Linear mixed effects model was used to assess differences in copy number corrected relative abundances for each diet per study phase. D) Principal coordinate analysis of Bray-Curtis distances of shotgun metagenomics data representing the samples collected 14–28 months after the Abx/PEG intervention (PS) from the subjects that participated in the original study as well as the samples collected on day 1 (pre Abx/PEG intervention), 5 (end of the diet phase), and 15 (end of study) of the original study.
