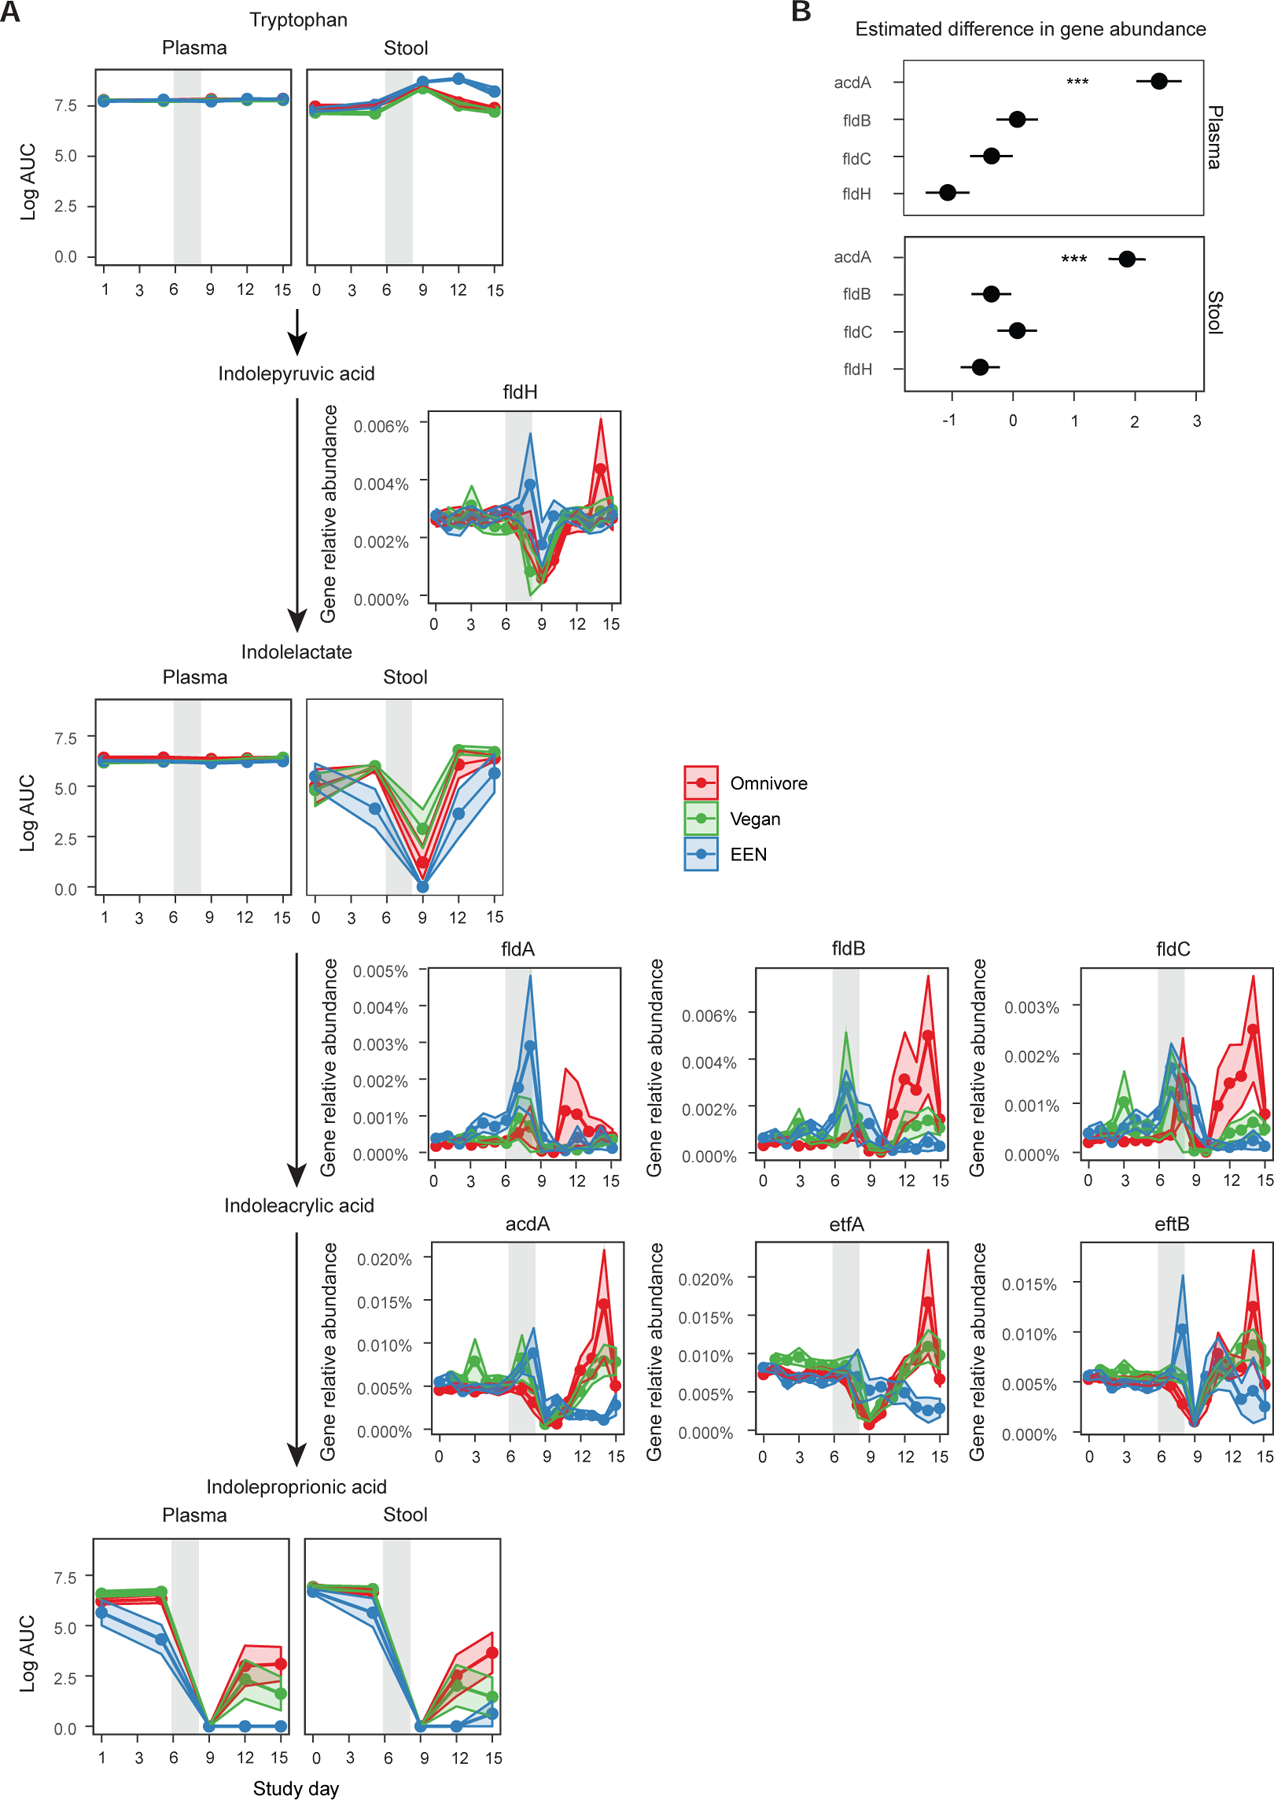
Figure 5.

The reduction pathway of tryptophan to indole propionic acid. A) The intermediate metabolite levels in plasma and stool are shown for each diet group connected by the arrows to denote the progression of enzymatic reactions. The relative abundance of genes and their co-activators responsible for a reaction are denoted next to the arrows. The confidence intervals represent the SEM and the gray shaded areas represent the antibiotic/PEG phase of the study. Linear mixed effects model was used to assess differences in gene relative abundances or metabolite log area under the curve (AUC) values for each diet per study phase. B) Results of the generalized linear mixed effects model to determine which enzyme is a better predictor of indolepropionic acid levels in the plasma or the stool. The outcome was the presence or absence of indole propionic acid in stool or plasma (binary outcome transformed with binomial link) and the predictors were limited to the main enzymes and did not include any co-activators or cofactors to avoid collinearity.
