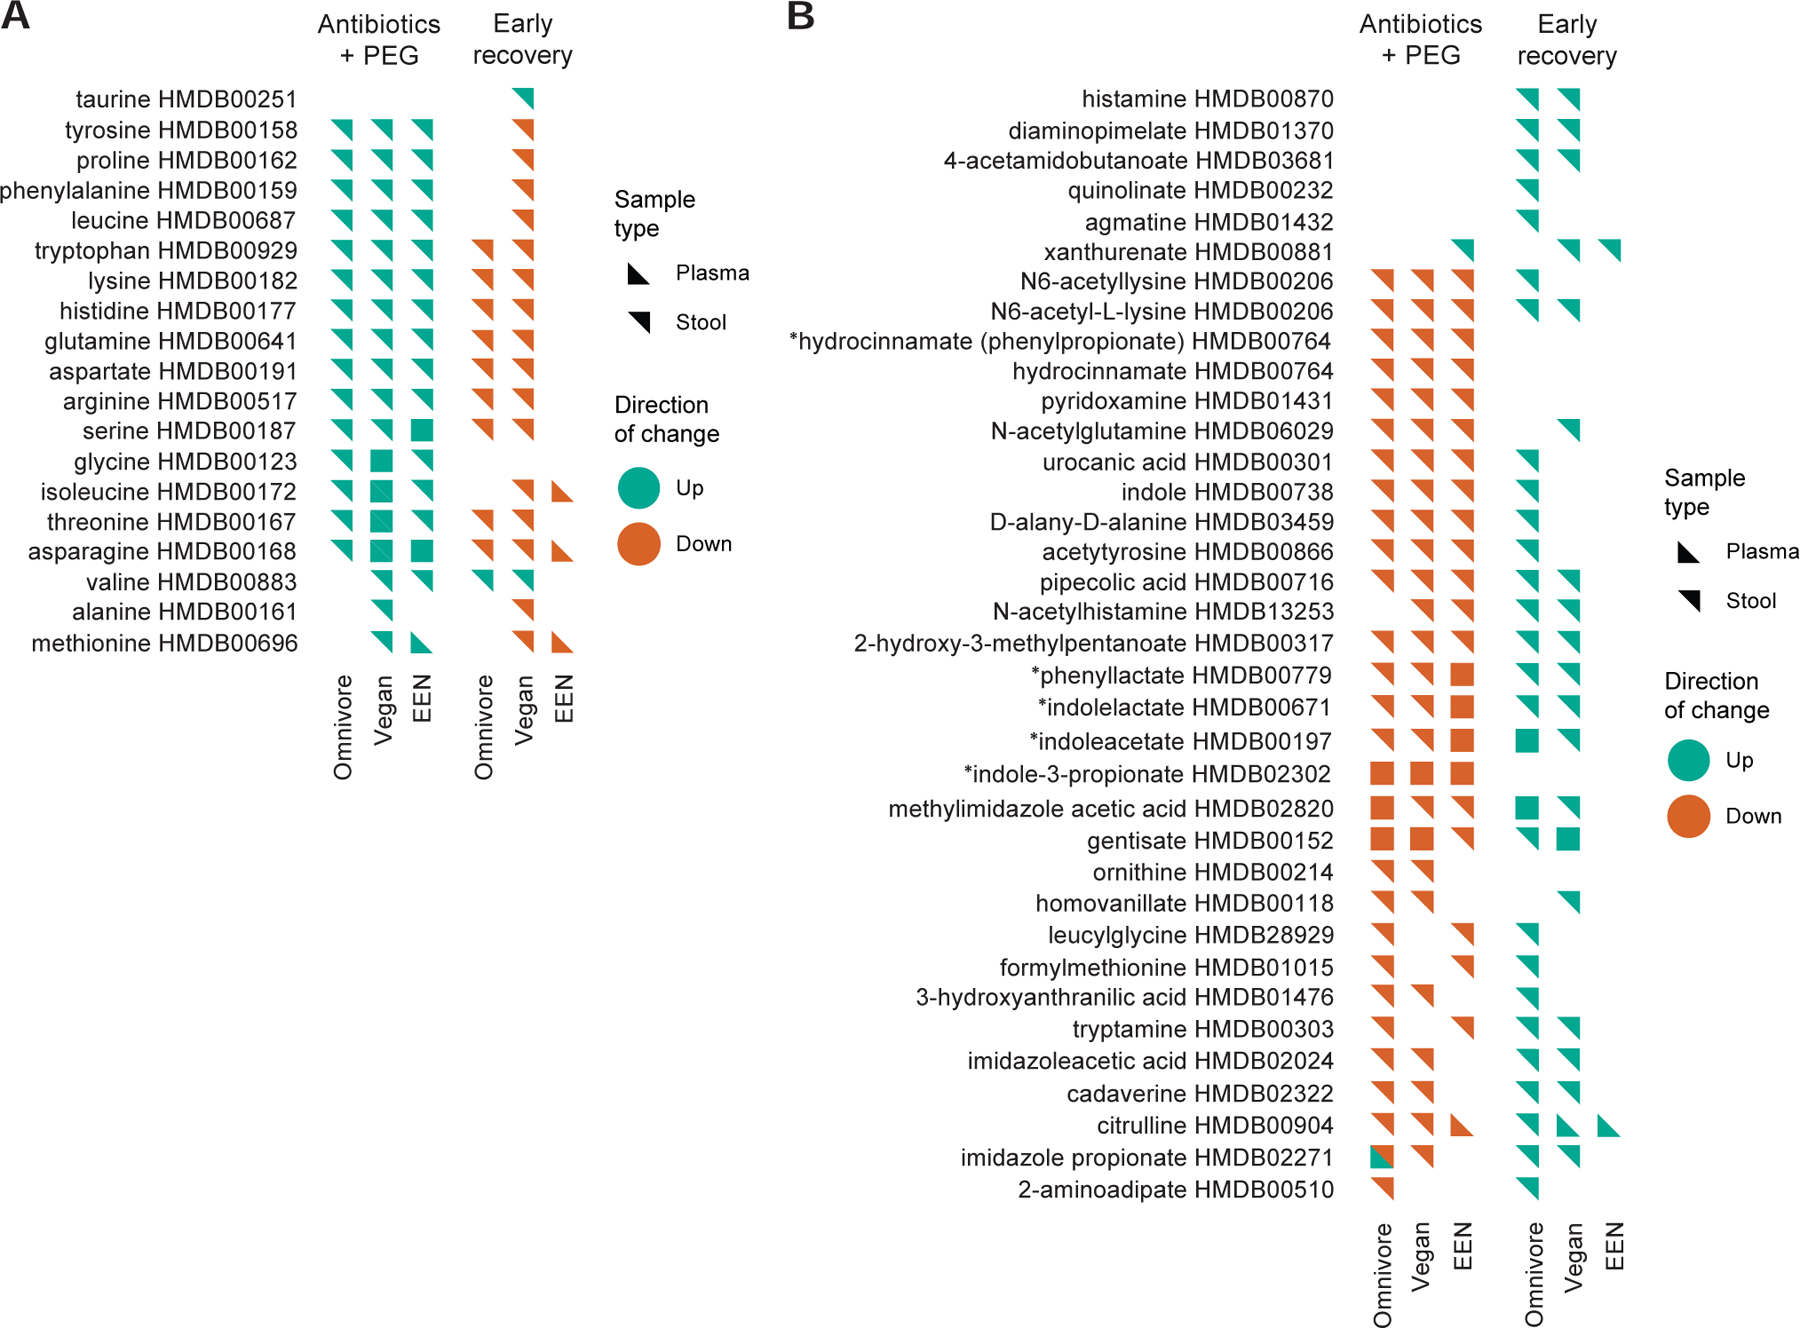
Figure 7.

Lists of fecal metabolites, annotated as “amino acids” by the Human Metabolome Database (HMDB) with statistically-significant interval changes in both the plasma and stool using the paradigm described in Figure 6B. Interval changes during both the “Abx/PEG intervention” and “Early Recovery” phases of the FARMM study for each of the three diets are shown. A) Amino acids, many purged from the gut and likely to be consumed by the gut microbiota upon early recovery. B) Amino acid and other nitrogen-based metabolites likely to be produced by the gut microbiota.*=Bacterially-produced amino acid metabolites described in(Dodd et al., 2017). Green=Interval increase in relative abundance. Orange=Interval decrease relative abundance. Orientation of the triangle symbol indicates whether the interval alteration in the metabolite was observed in the plasma or stool. HMBD annotations are provided for each metabolite.
